Highlights
Year ended 31 December | |||
|---|---|---|---|
HK$ million | 2019 | 2018 | Increase/(Decrease) |
Revenue | 566,497 | 533,285 | 6.2% |
Profit before taxation | 96,015 | 93,969 | 2.2% |
Profit attributable to ordinary shareholders | 53,903 | 50,239 | 7.3% |
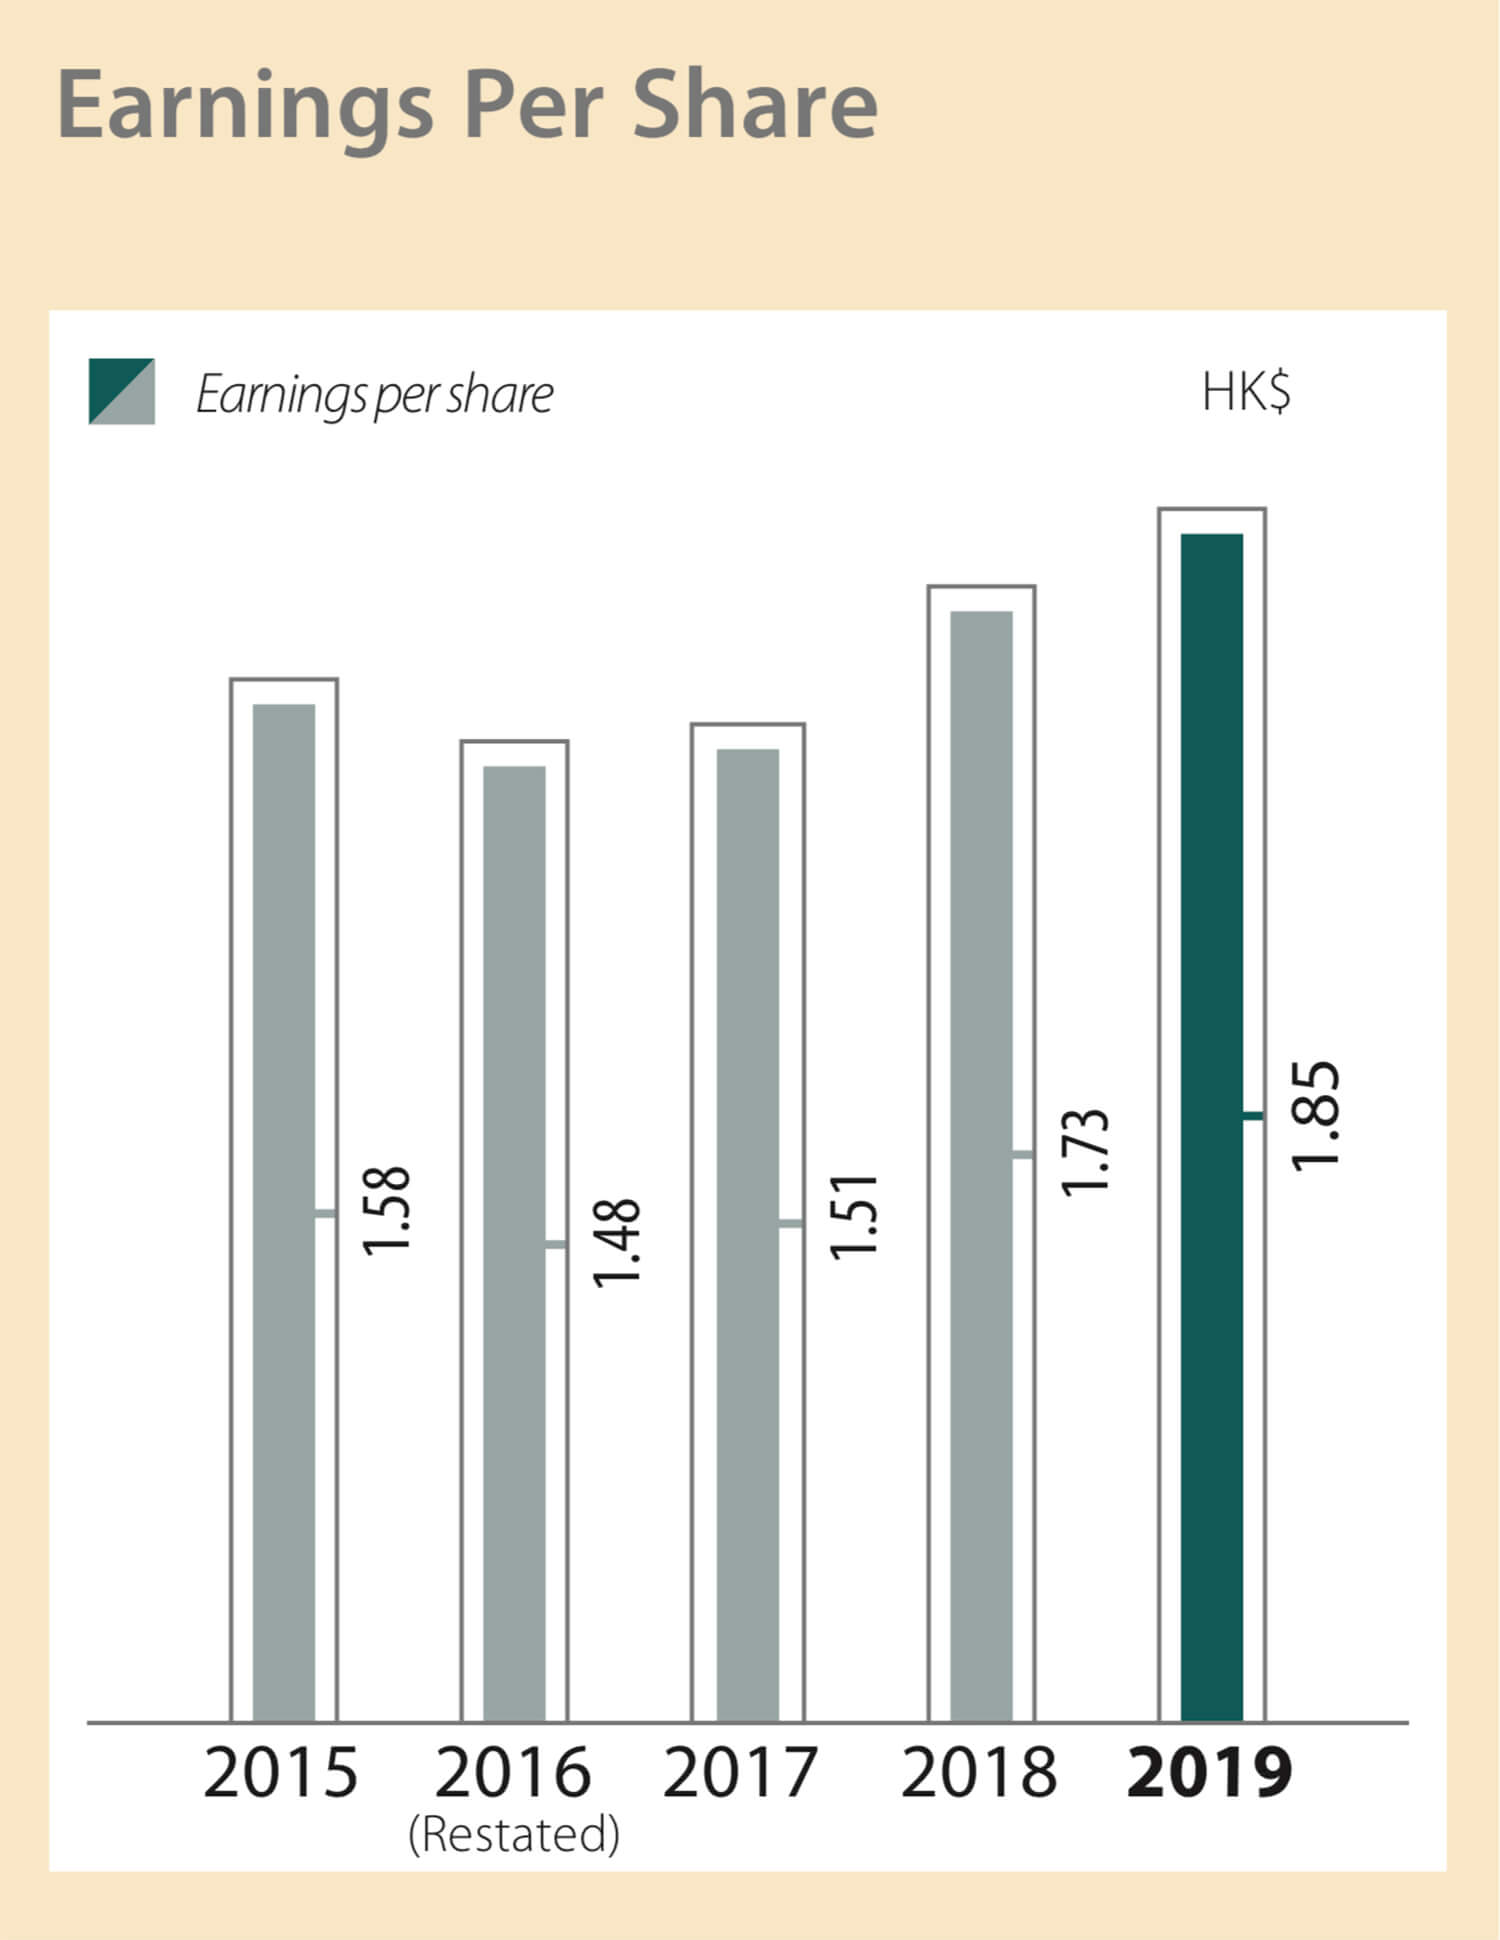
Basic earnings per share (HK$) | 1.85 | 1.73 | 7.3% |
Diluted earnings per share (HK$) | 1.85 | 1.73 | 7.3% |
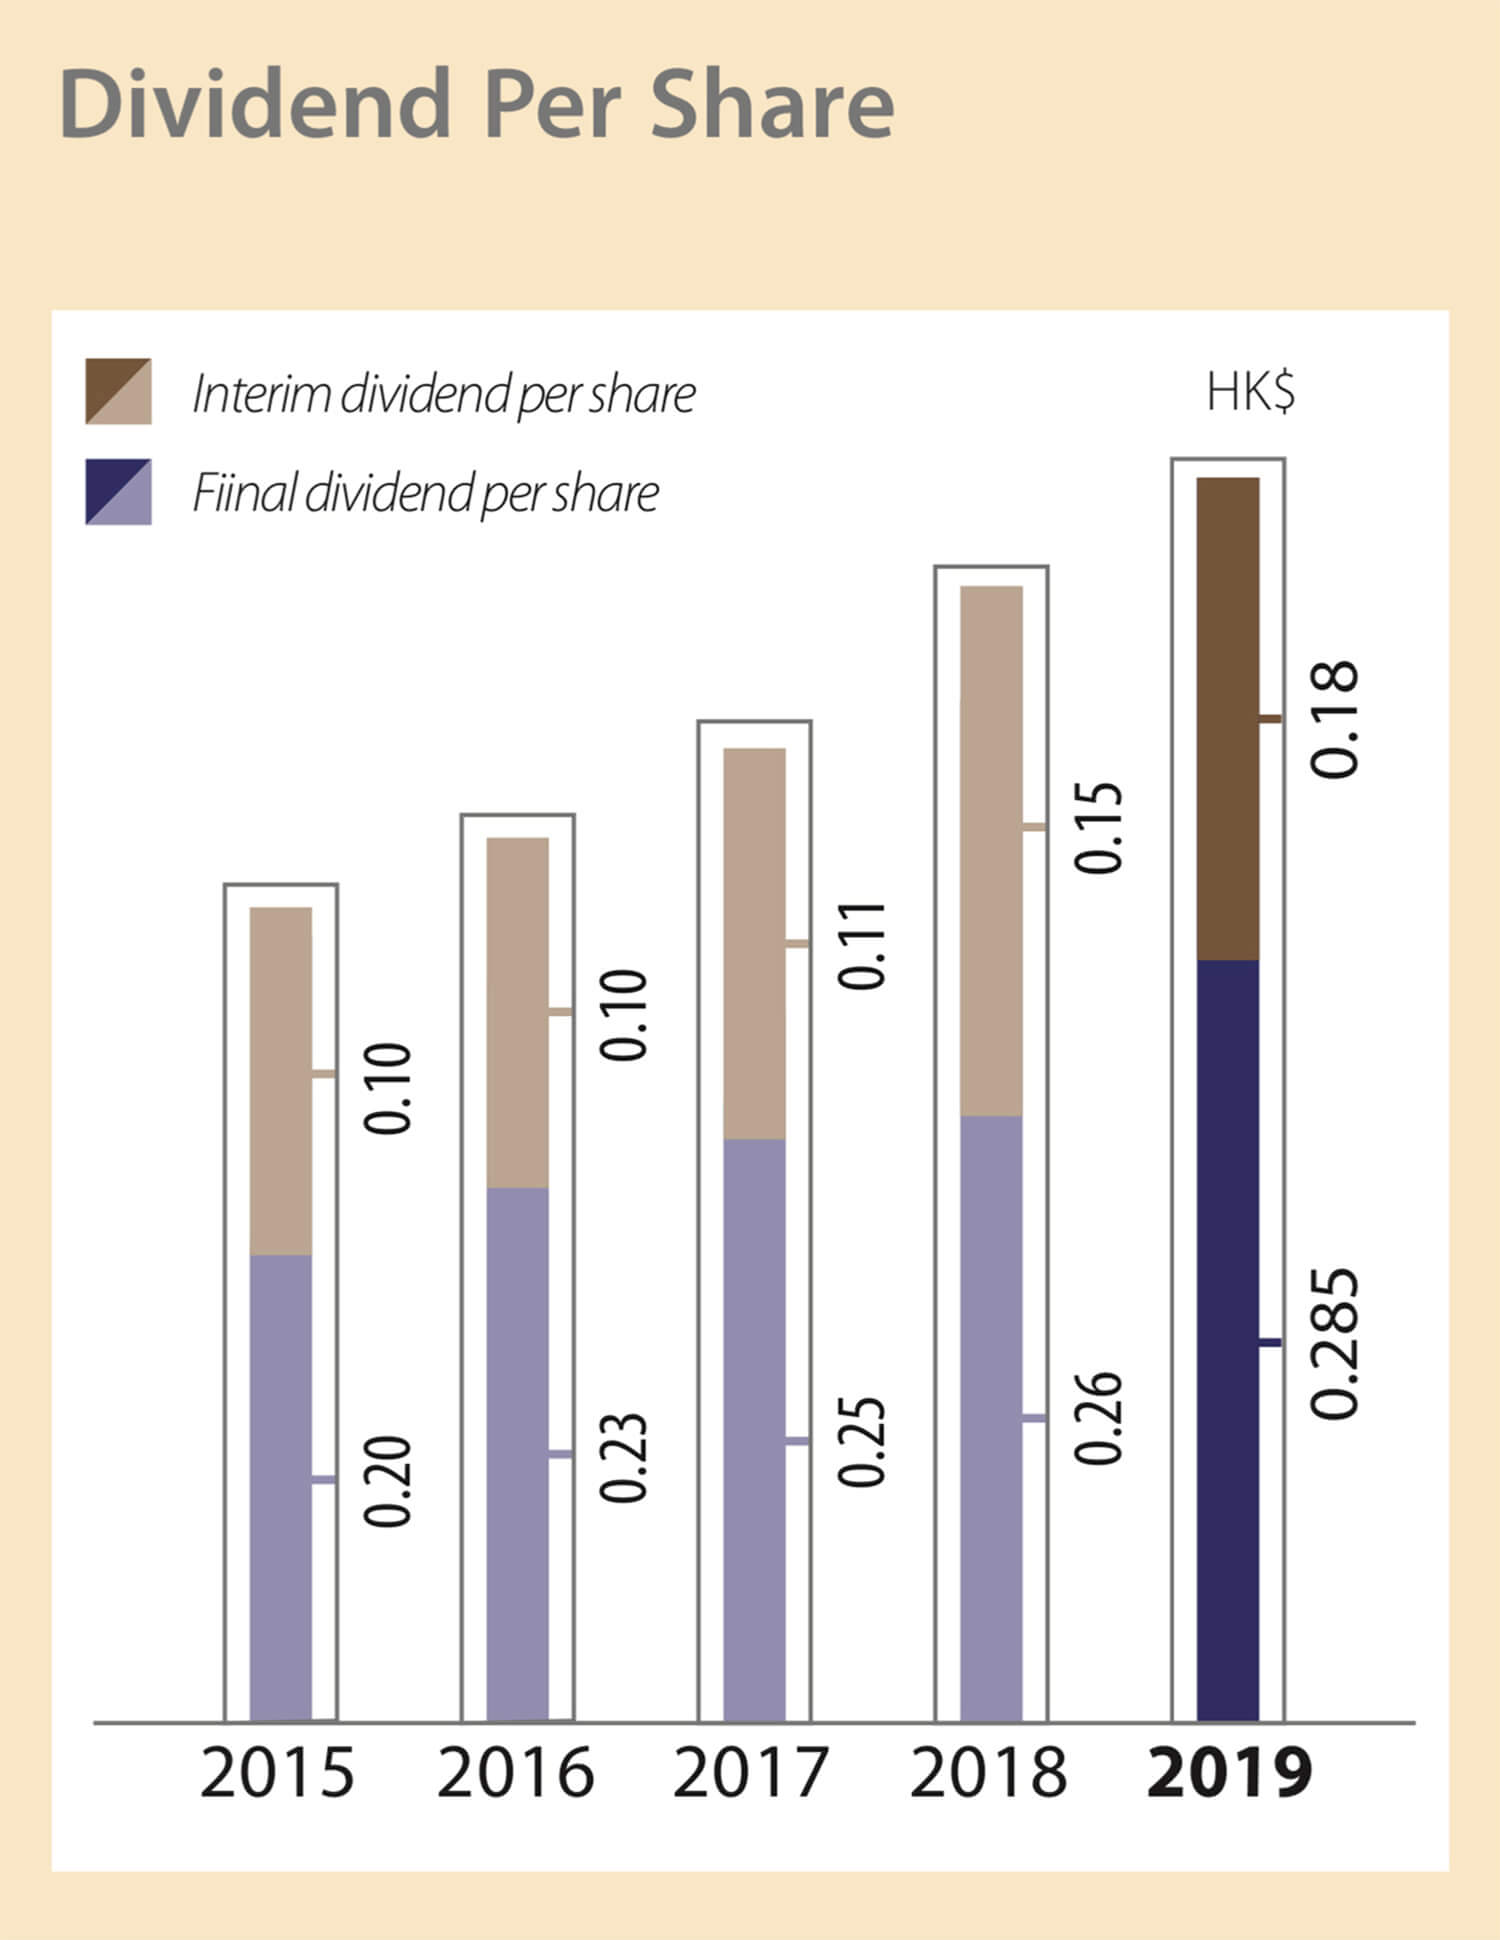
Dividend per share (HK$) | 0.465 | 0.41 | 13% |
Net cash generated from operating activities | 160,082 | 151,899 | 5.4% |
Capital expenditure | 32,318 | 43,802 | (26%) |
HK$ million | As at 31 December 2019 | As at 31 December 2018 | Increase/(Decrease) |
|---|---|---|---|
Total assets | 8,289,924 | 7,660,713 | 8.2% |
Total liabilities | 7,395,433 | 6,850,053 | 8.0% |
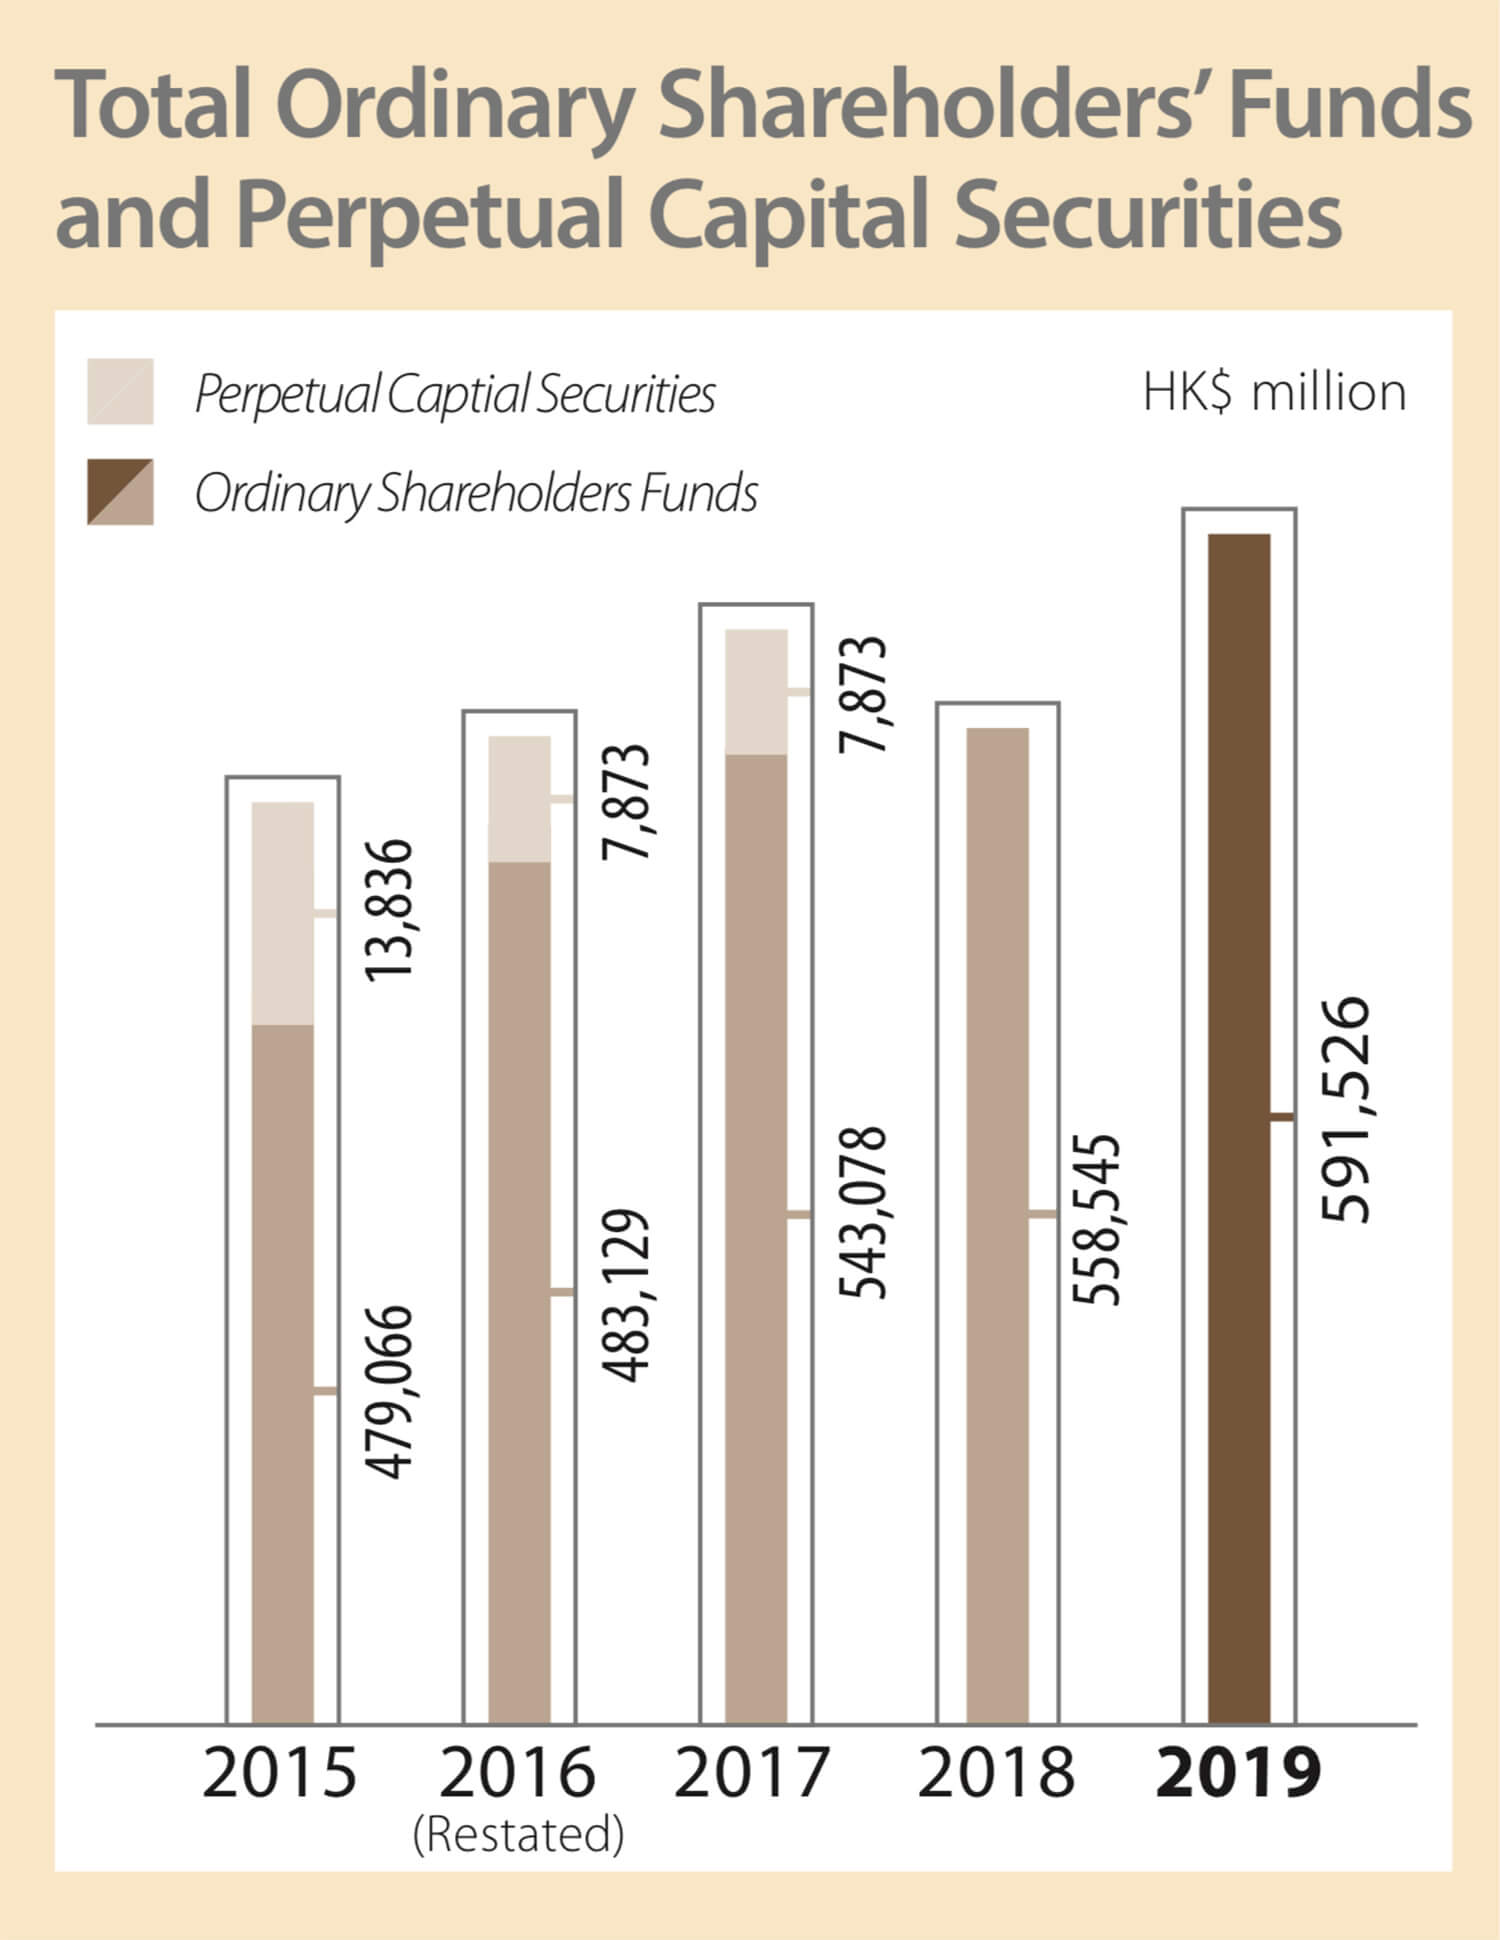
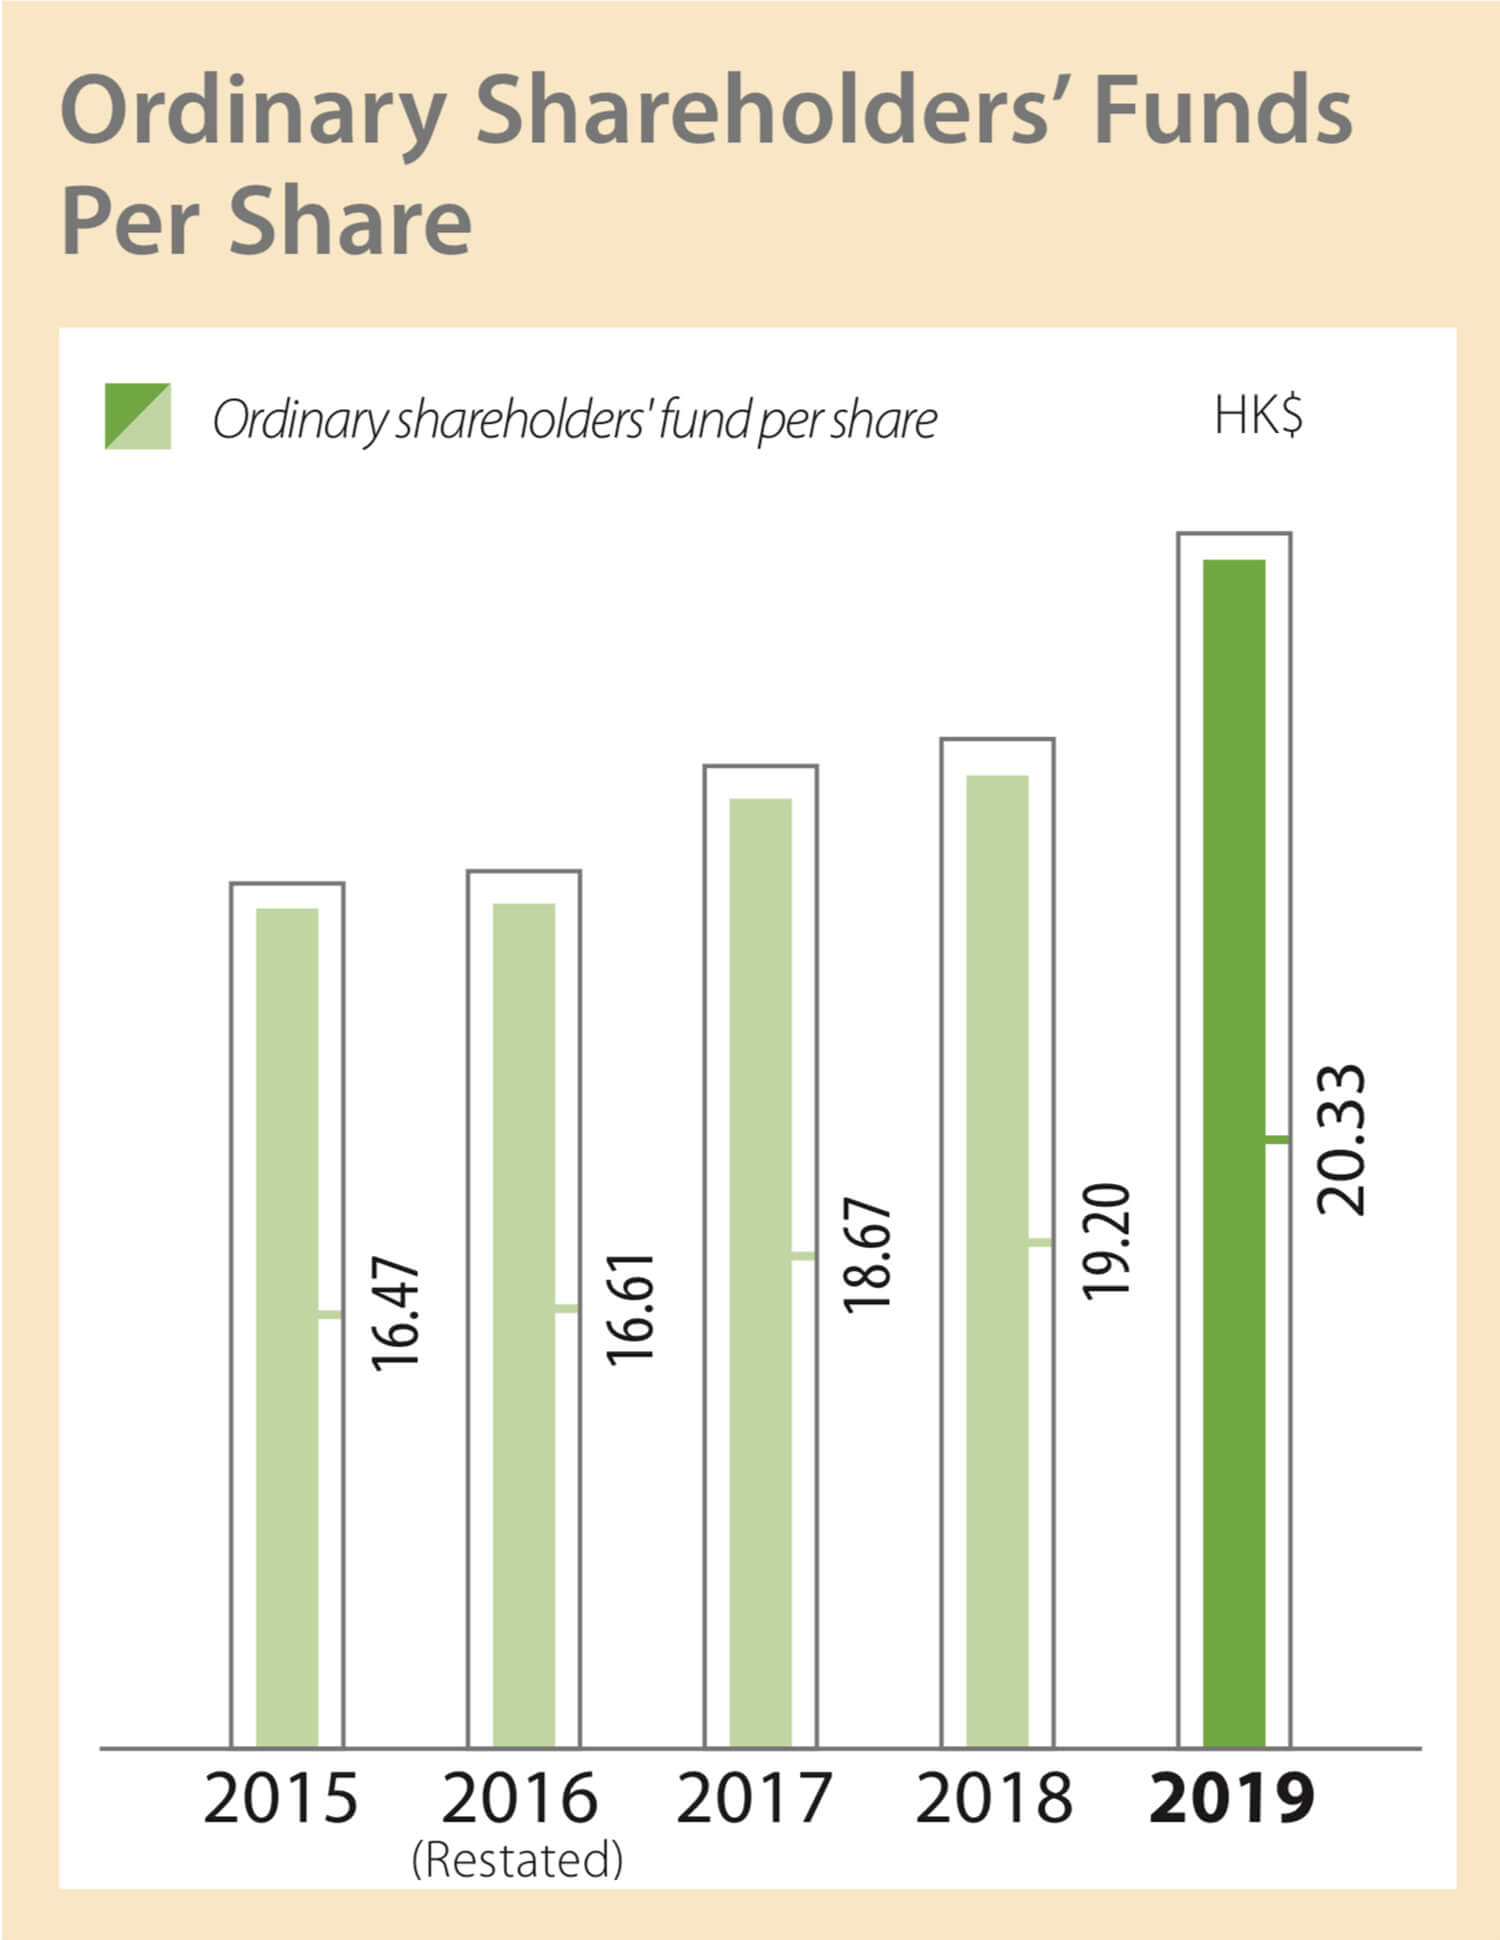
Total ordinary shareholders’ funds | 591,526 | 558,545 | 5.9% |
Return on total assets (%) | 1.4% | 1.4% | - |
Return on net assets (%) | 9.4% | 9.1% | 0.3pp |
Staff employed | 287,910 | 273,344 | 5.3% |
Business assets | Revenue from external customers | Profit attributable to ordinary shareholders | |||||||
|---|---|---|---|---|---|---|---|---|---|
Business | As at 31 | Increase/ | Increase/ (decrease) excluding the effect of currency translation | Year ended 31 | Increase/ | Increase/ (decrease) excluding the effect of currency translation | Year ended 31 | Increase/ | Increase/ (decrease) excluding the effect of currency translation |
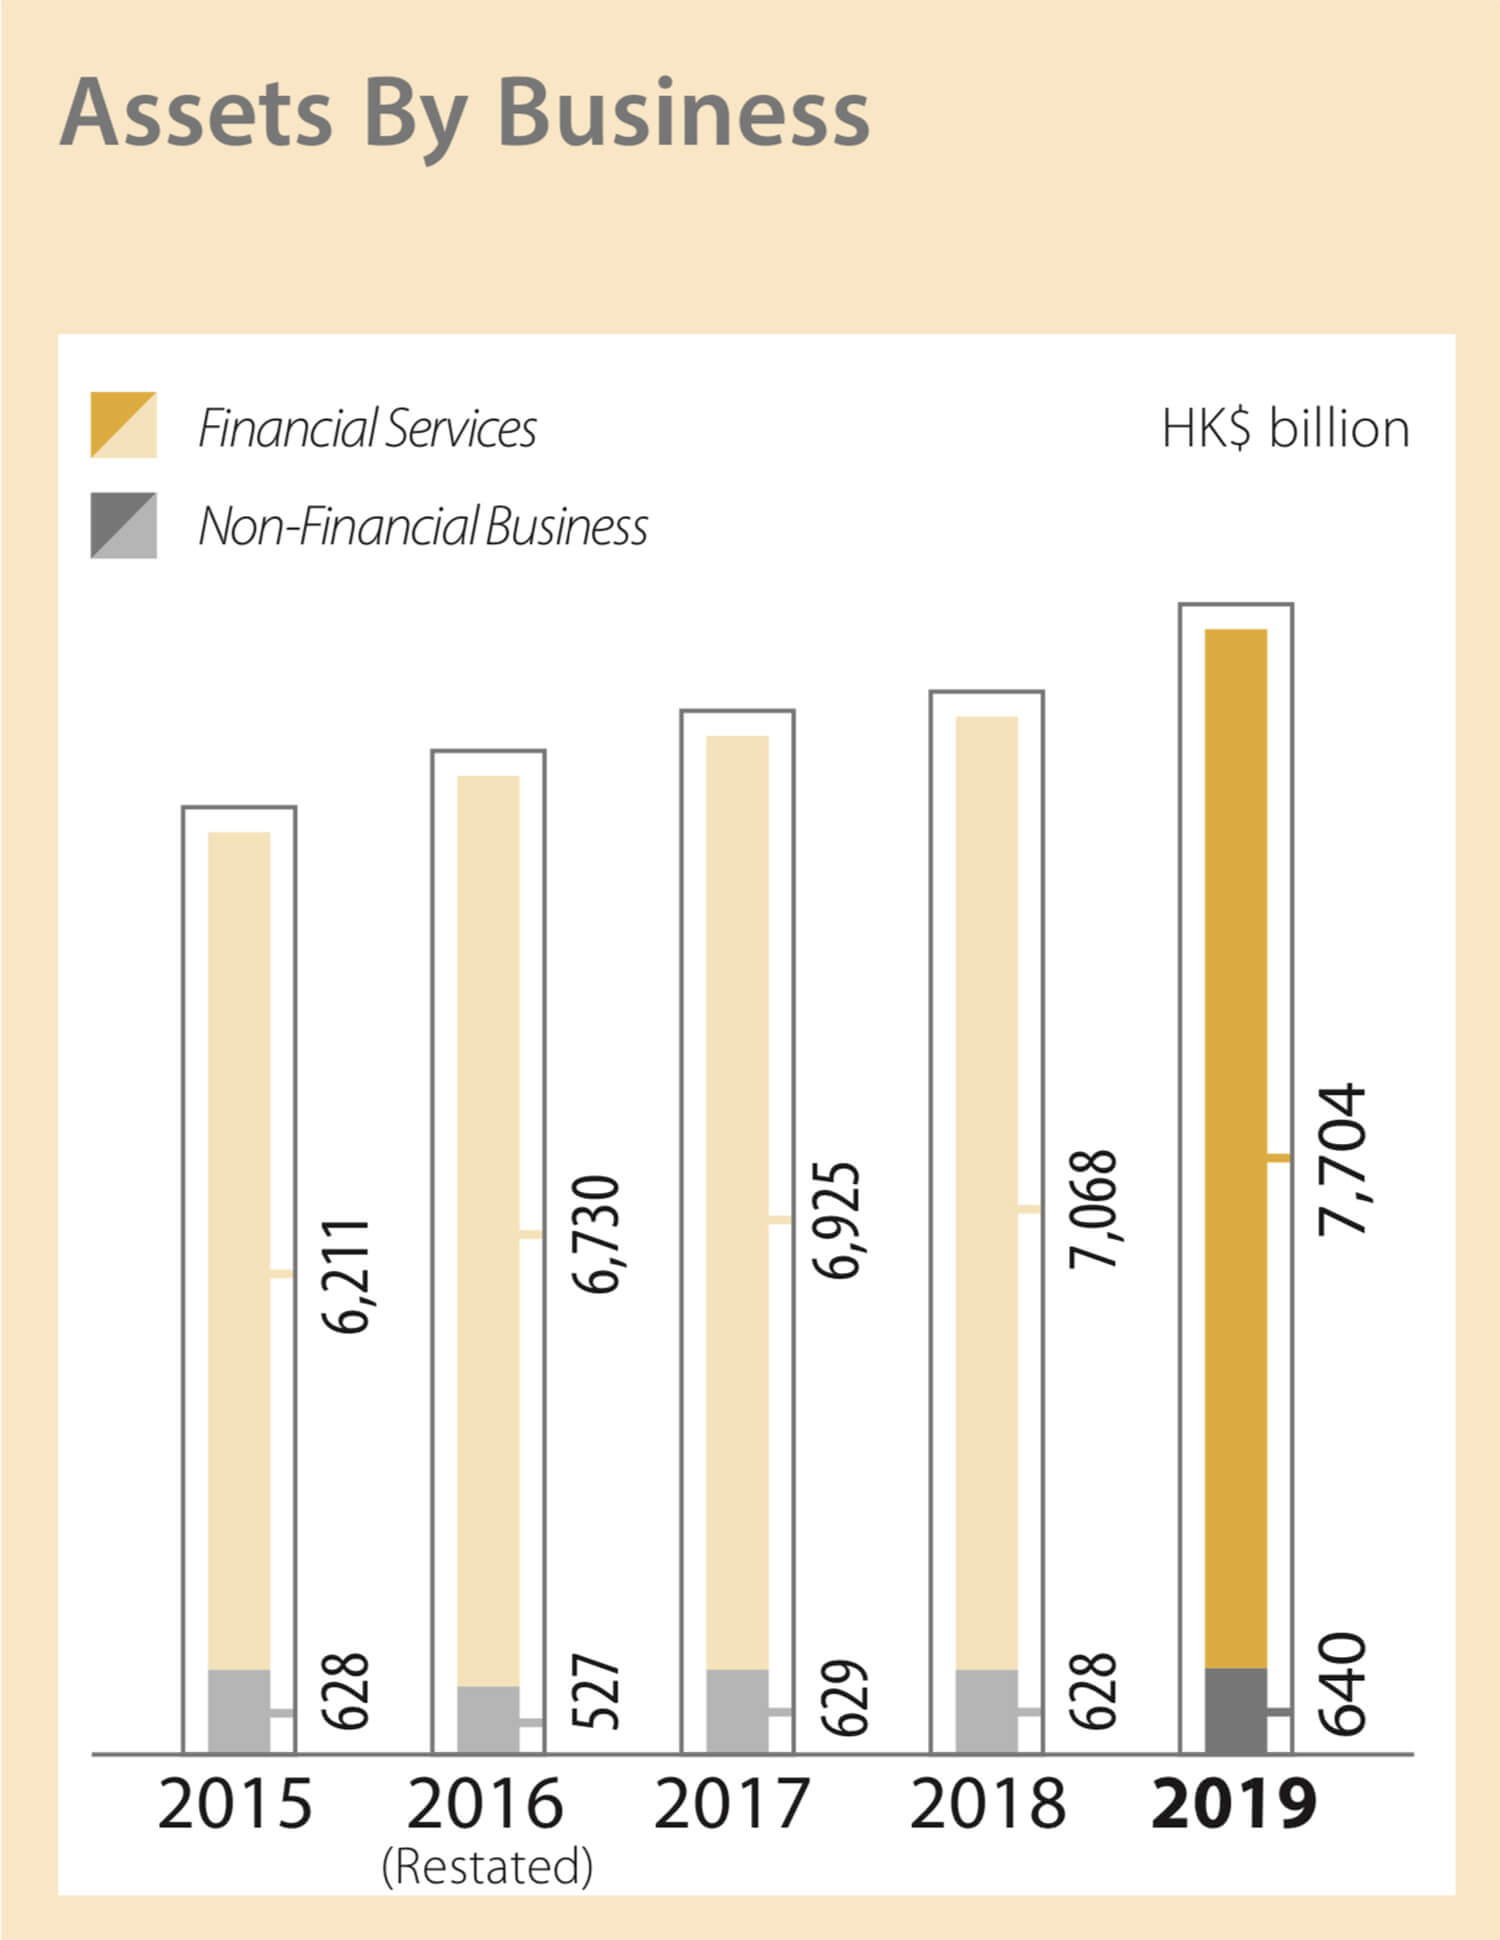
Financial services | 7,703,980 | 9.0% | 9.3% | 222,316 | 9.5% | 14% | 42,845 | 2.7% | 6.9% |
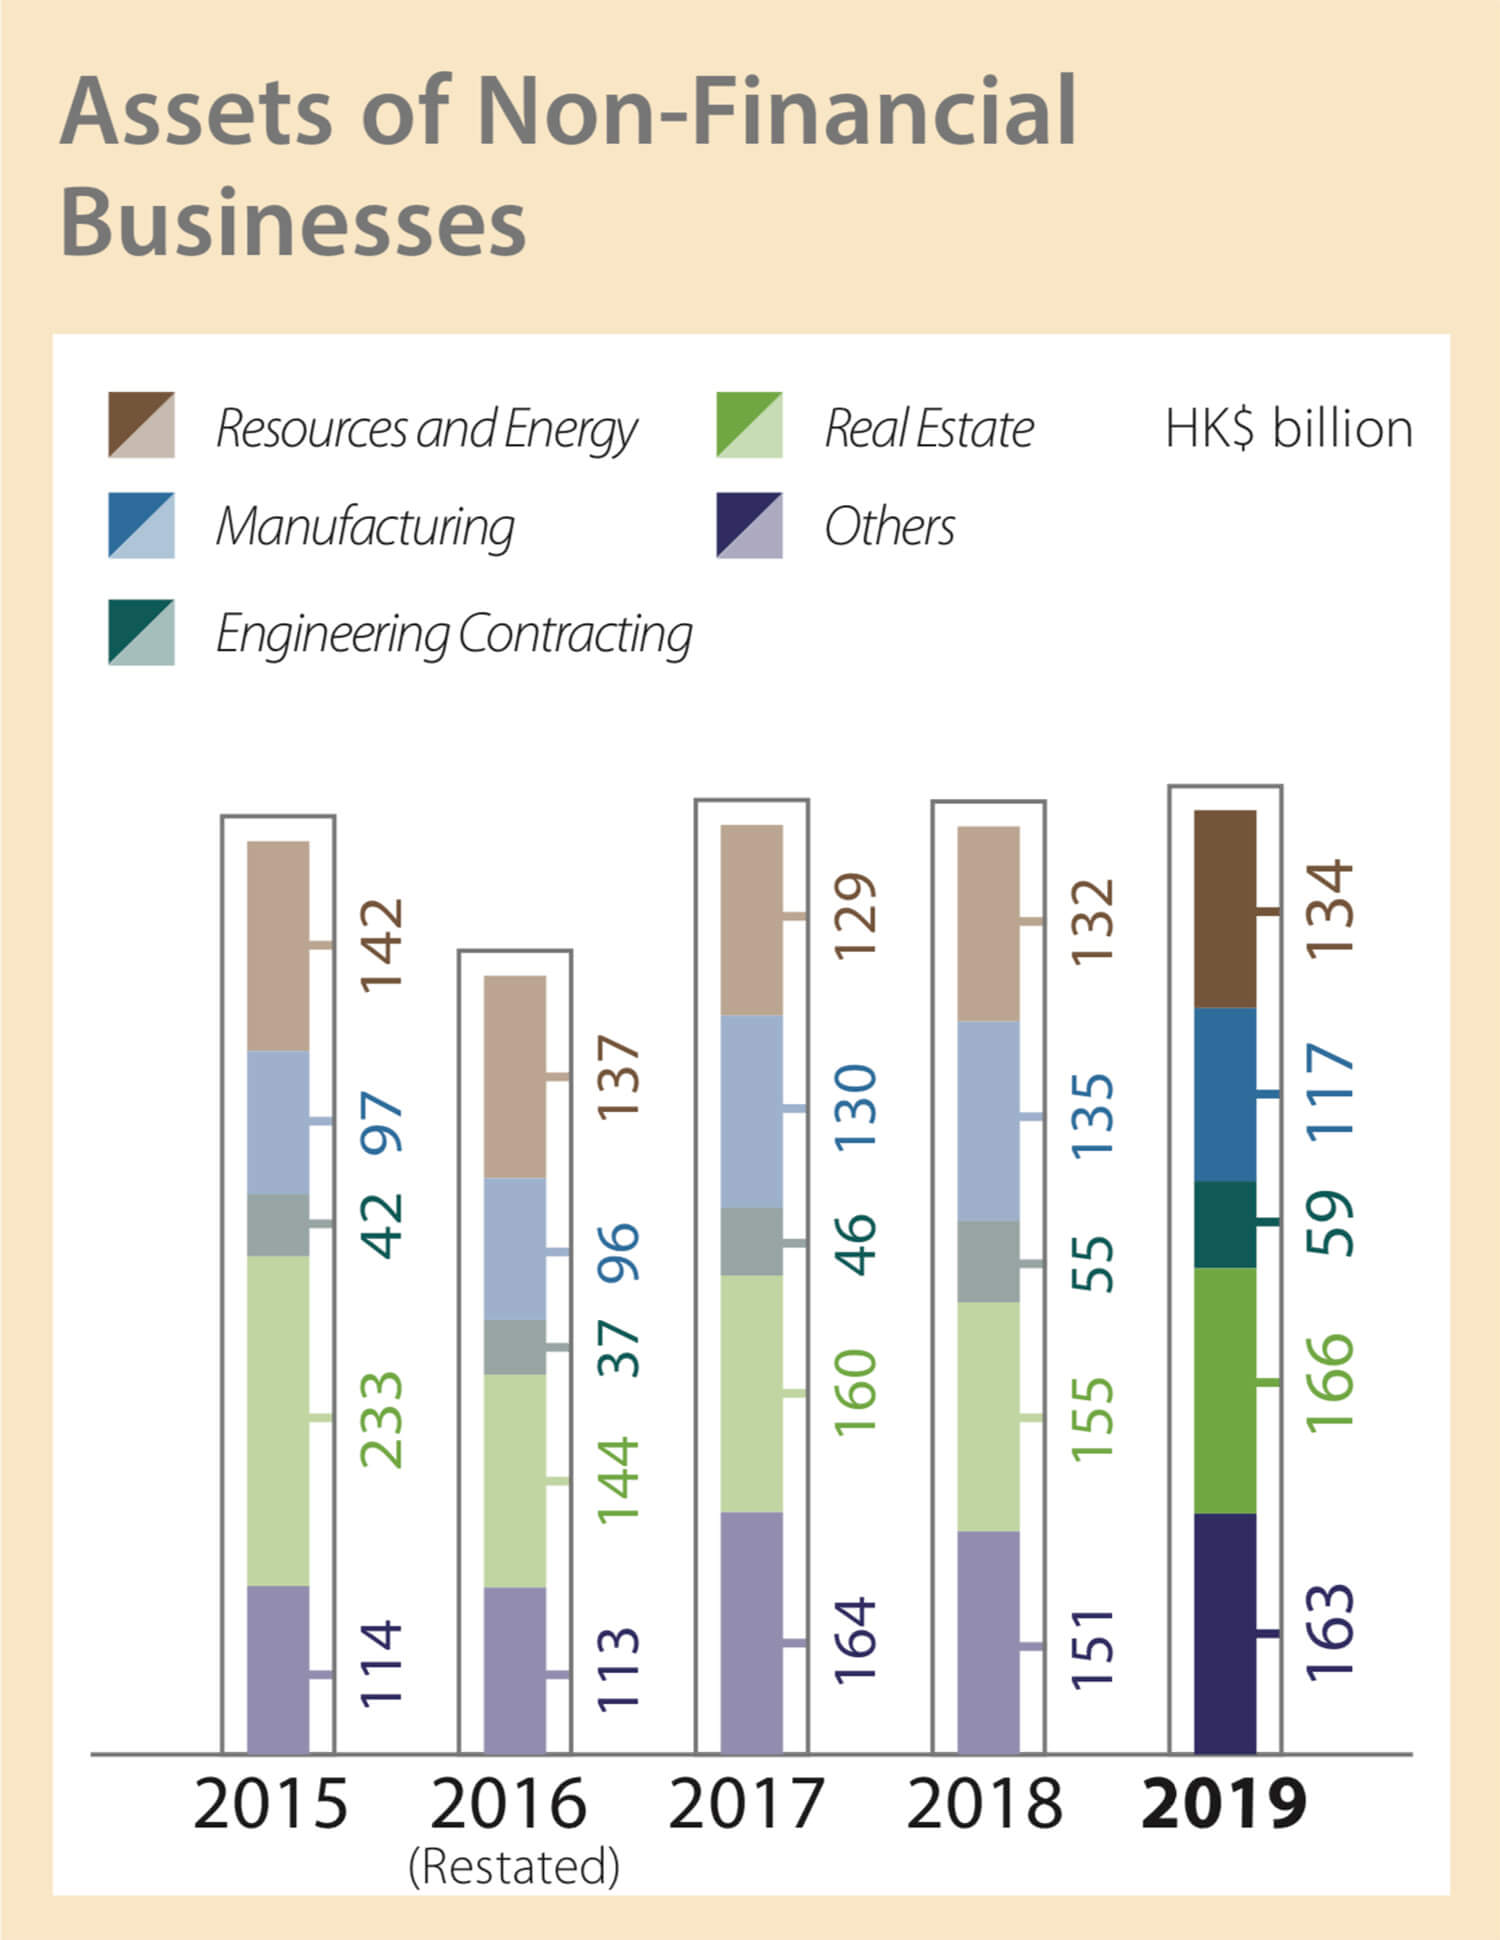
Resources and energy | 134,304 | 1.9% | 2.4% | 94,951 | 21% | 21% | 3,015 | 43% | 48% |
Manufacturing | 117,240 | (13%) | (13%) | 119,328 | (2.1%) | 1.9% | 7,553 | 26% | 31% |
Engineering contracting | 59,030 | 6.5% | 6.8% | 23,373 | 19% | 24% | 1,867 | (9.1%) | (5.4%) |
Real Estate | 166,404 | 7.6% | 7.7% | 5,943 | (34%) | (31%) | 4,347 | (19%) | (15%) |
Others | 162,893 | 7.8% | 8.0% | 100,546 | (0.4%) | 0.2% | 2,556 | 25% | 27% |