

Highlights
Year ended 31 December | |||
|---|---|---|---|
HK$ million | 2018 | 2017 | Increase/(Decrease) |
Revenue | 533,285 | 450,536 | 82,749 |
Profit before taxation | 93,969 | 82,783 | 11,186 |
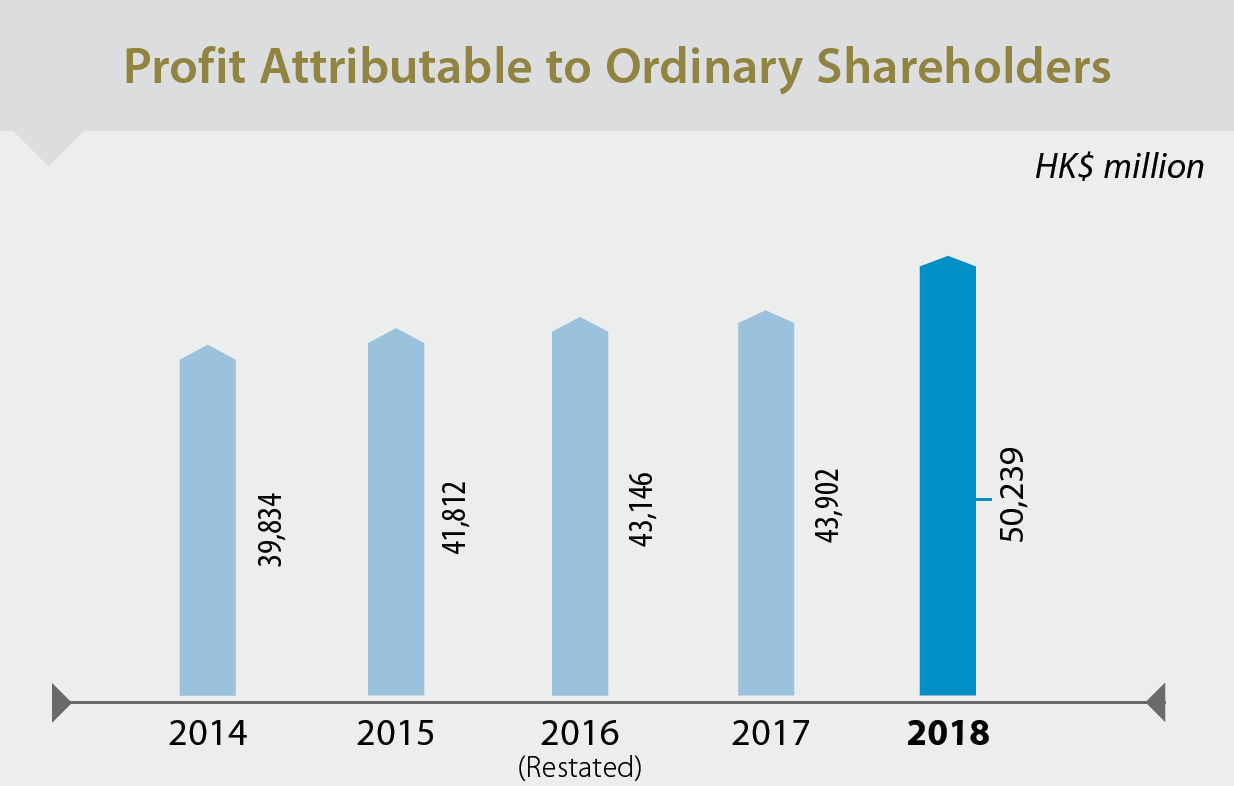
Profit attributable to ordinary shareholders | 50,239 | 43,902 | 6,337 |
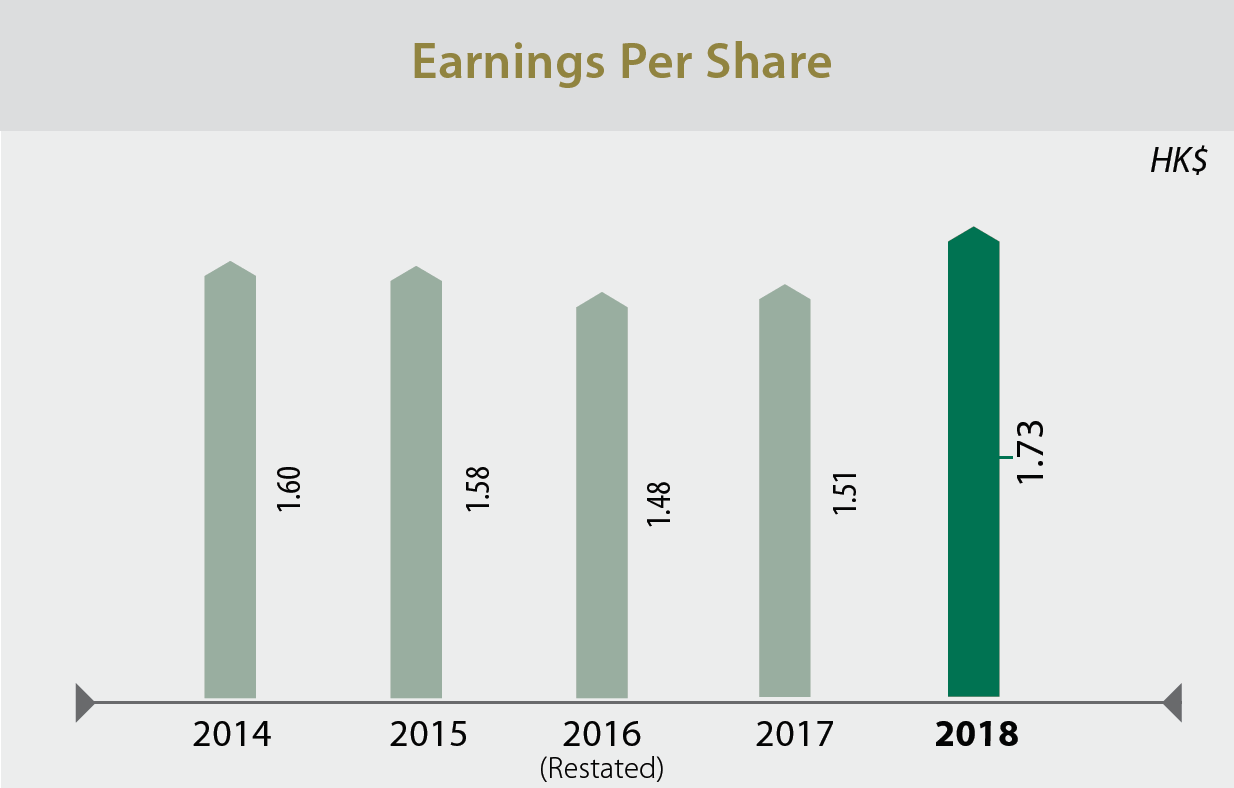
Basic earnings per share (HK$) | 1.73 | 1.51 | 0.22 |
Diluted earnings per share (HK$) | 1.73 | 1.51 | 0.22 |
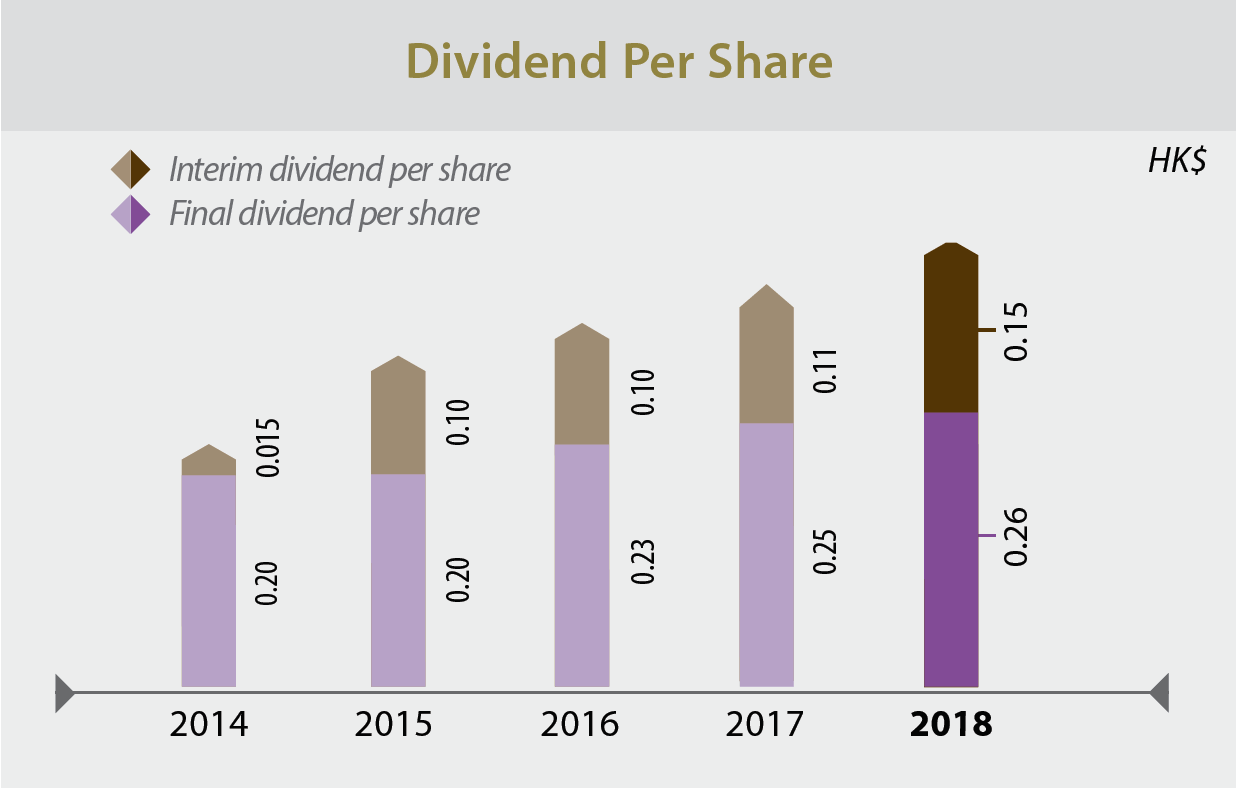
Dividend per share (HK$) | 0.41 | 0.36 | 0.05 |
Net cash generated from operating activities | 151,899 | 107,133 | 44,766 |
Capital expenditure | 43,802 | 45,323 | (1,521) |
HK$ million | As at 31 December 2018 | As at 31 December 2017 | Increase/(Decrease) |
|---|---|---|---|
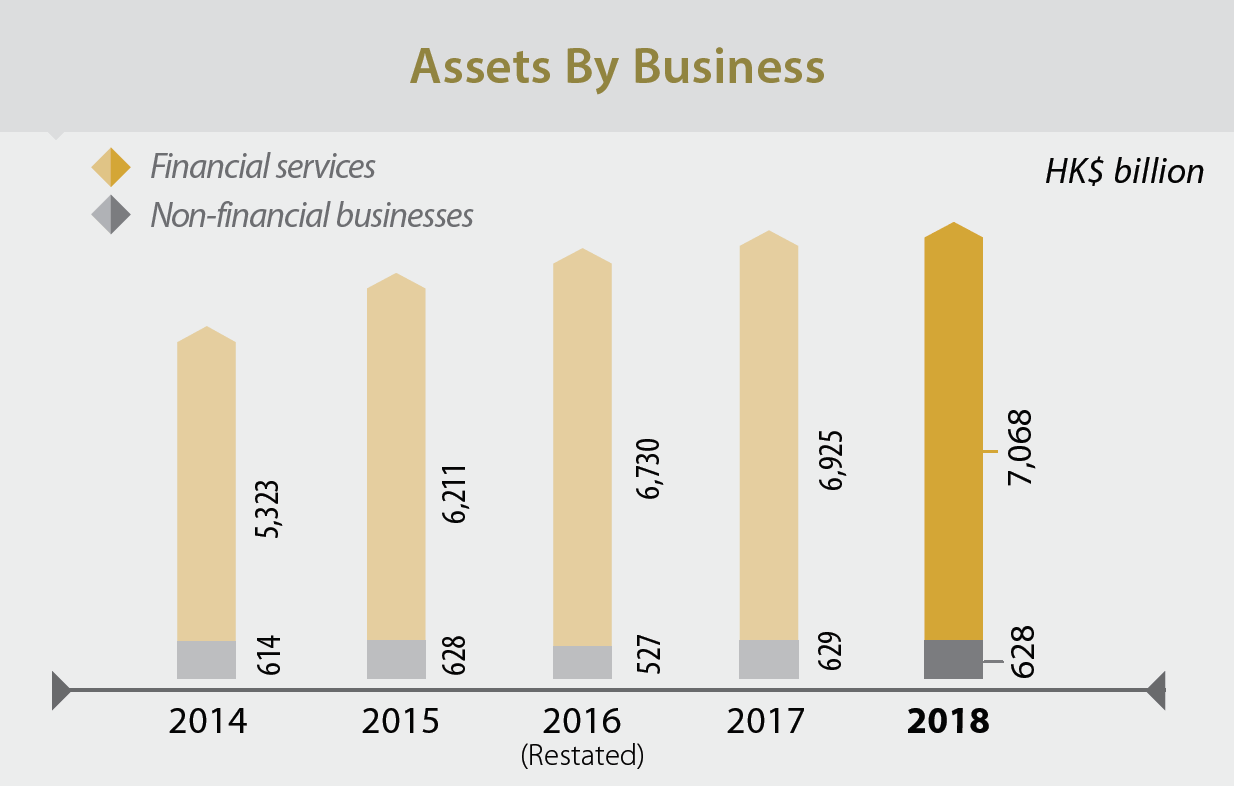
Total assets | 7,660,713 | 7,520,739 | 139,974 |
Total liabilities | 6,850,053 | 6,727,098 | 122,955 |
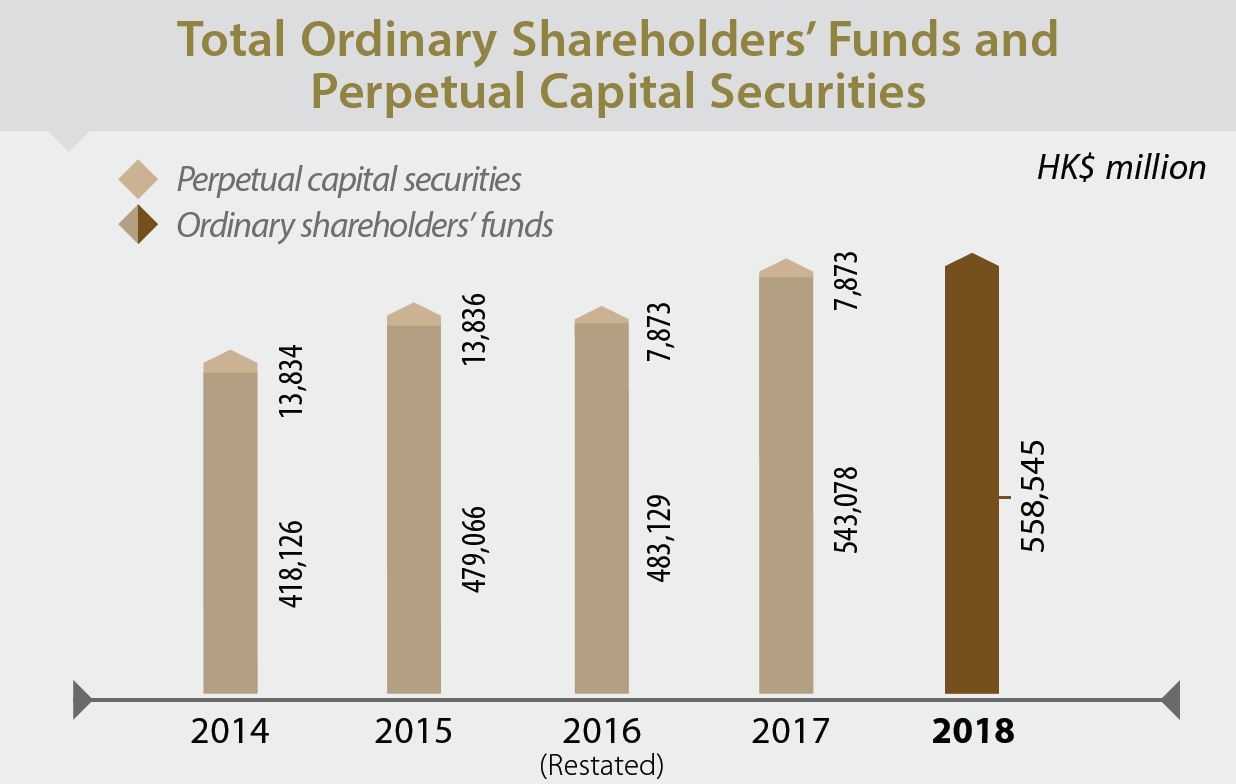
Total ordinary shareholders’ funds and perpetual capital securities | 558,545 | 550,951 | 7,594 |
Return on total assets (%) | 1.4% | 1.3% | 0.1% |
Return on net assets (%) | 9.1% | 8.6% | 0.5% |
Staff employed | 273,344 | 243,036 | 30,308 |
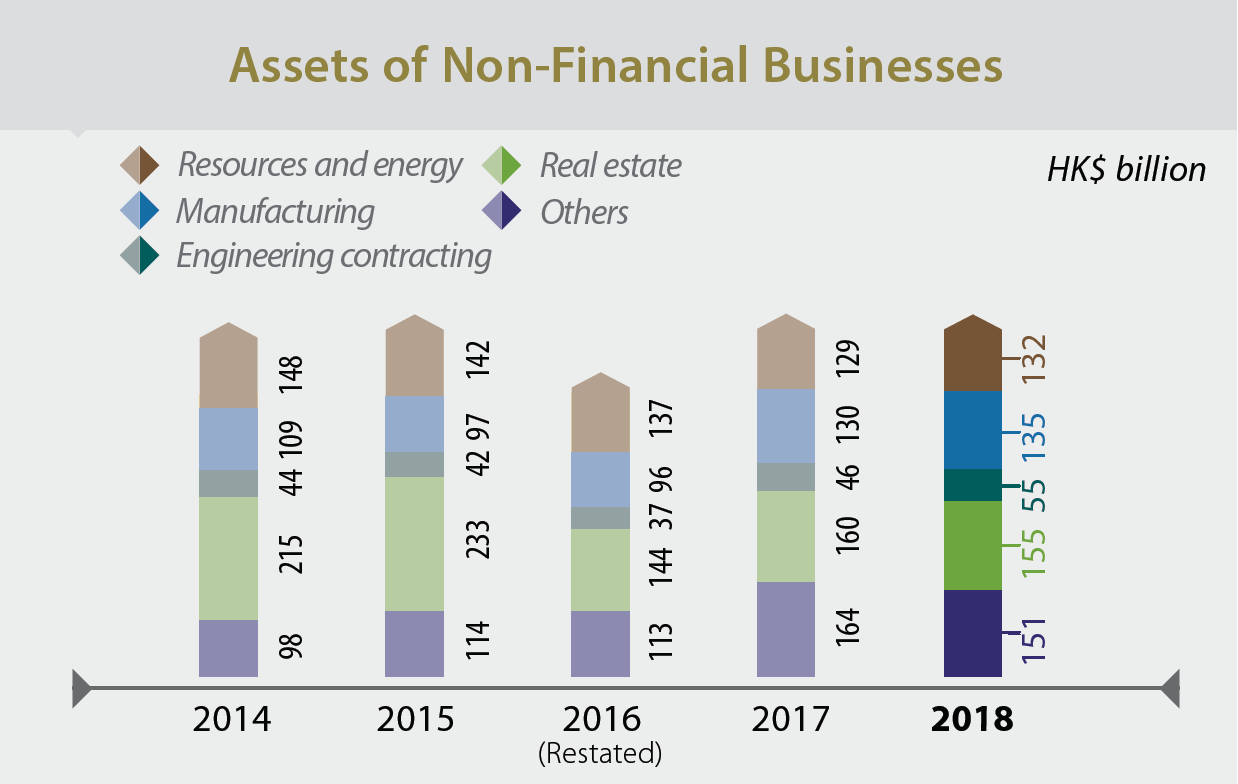
Business assets | Revenue from external customers | Profit attributable to ordinary shareholders | ||||
|---|---|---|---|---|---|---|
Business | As at 31 | Increase/ | Year ended 31 | Increase/ | Year ended 31 | Increase/ |
Financial services | 7,067,565 | 142,489 | 202,949 | 12,921 | 41,704 | 2,198 |
Resources and energy | 131,842 | 2,404 | 78,722 | 15,266 | 2,102 | 12,002 |
Manufacturing | 134,882 | 4,501 | 121,939 | 24,507 | 6,008 | 2,690 |
Engineering contracting | 55,432 | 9,305 | 19,700 | 5,047 | 2,053 | 322 |
Real Estate | 154,631 | (5,033) | 8,968 | 5,741 | 5,353 | (2,307) |
Others | 151,071 | (12,764) | 100,920 | 19,247 | 2,049 | (7,406) |
Chairman’s Letter to Shareholders