Highlights
Year ended 31 December | |||
|---|---|---|---|
HK$ million | 2020 | 2019 | Increase/(Decrease) |
Revenue | 552,949 | 566,497 | (2.4%) |
Profit before taxation | 97,718 | 96,015 | 1.8% |
Net profit | 80,928 | 78,188 | 3.5% |
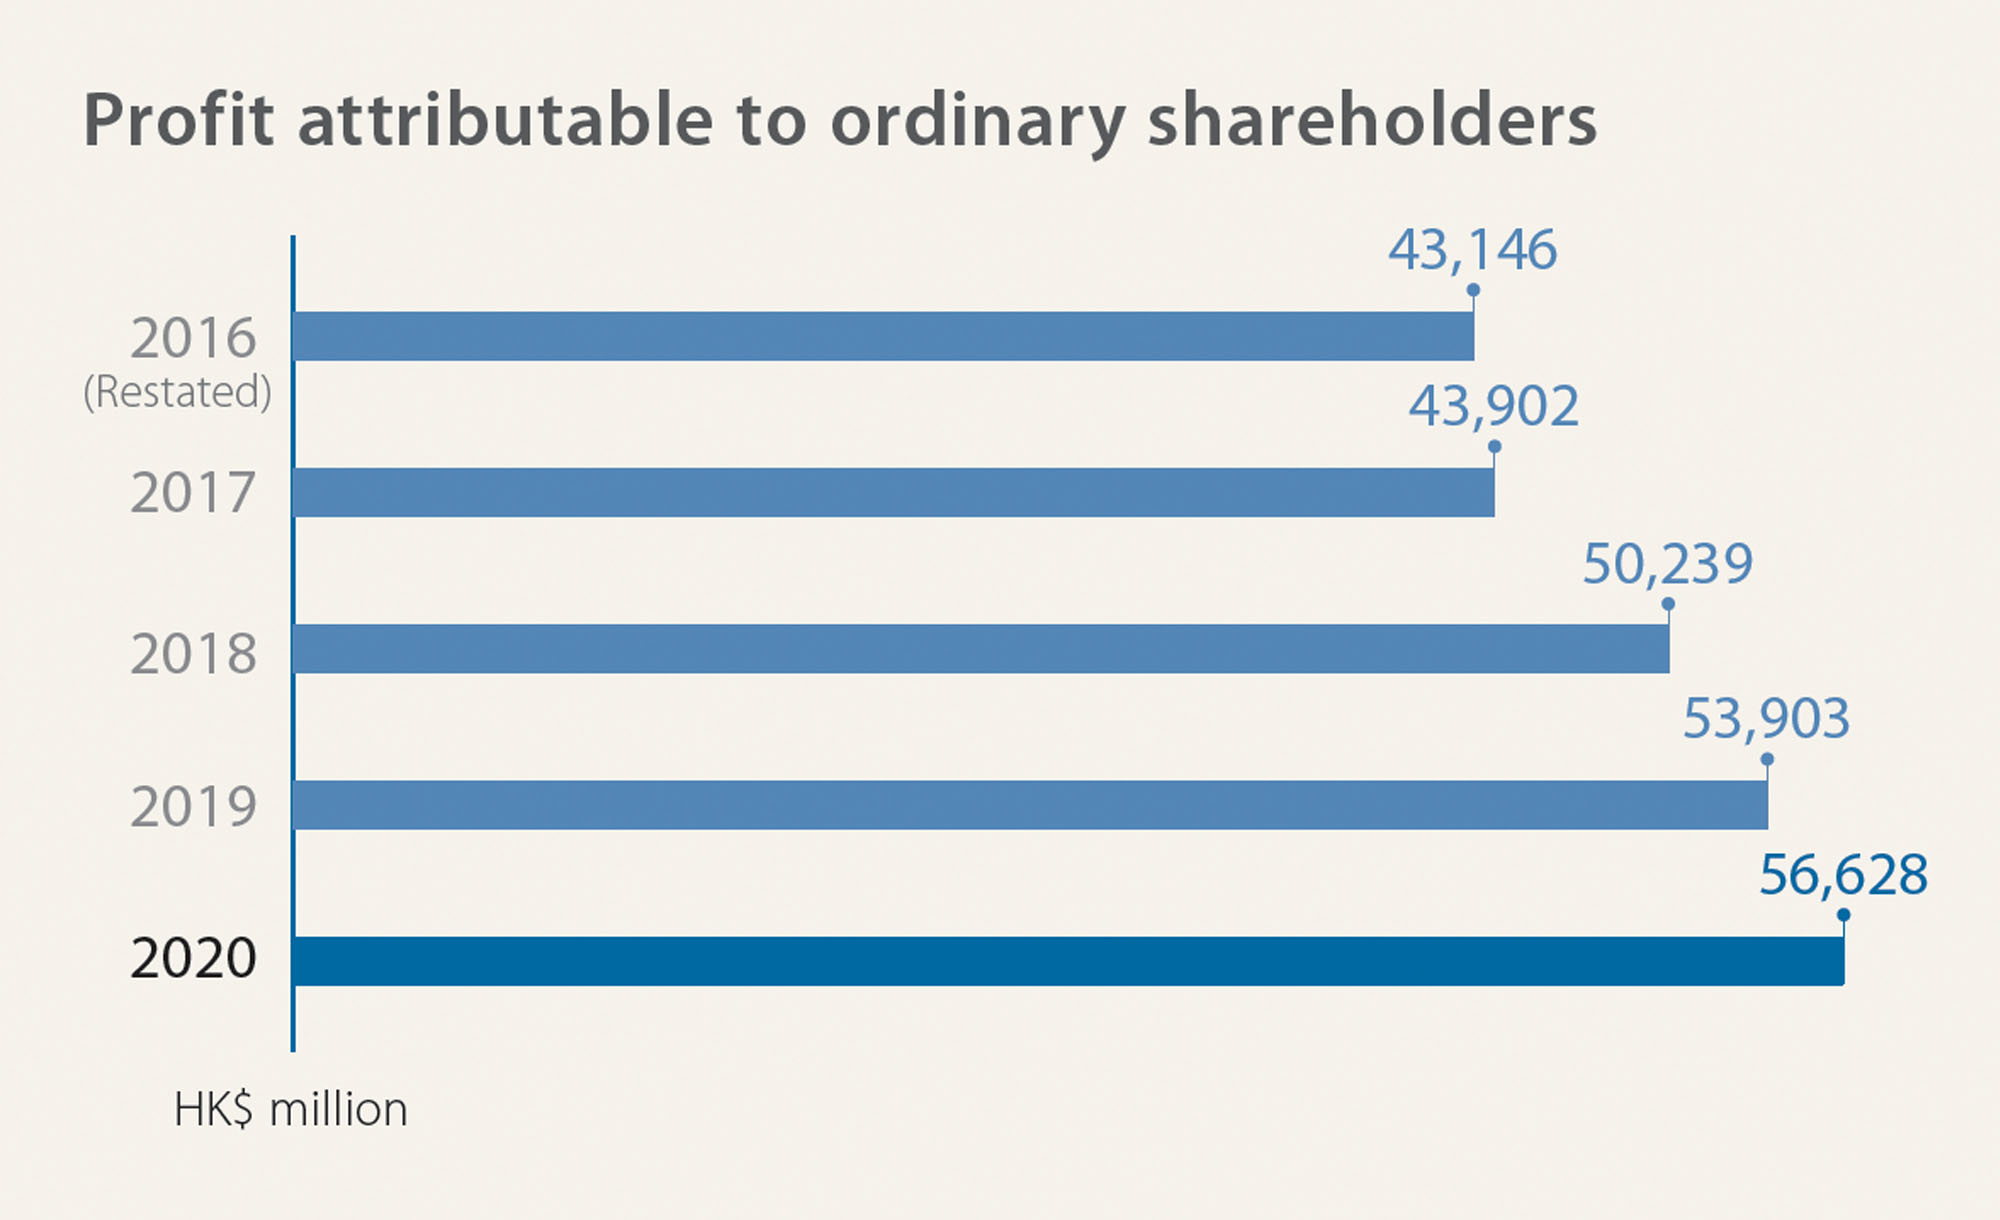
Profit attributable to ordinary shareholders | 56,628 | 53,903 | 5.1% |
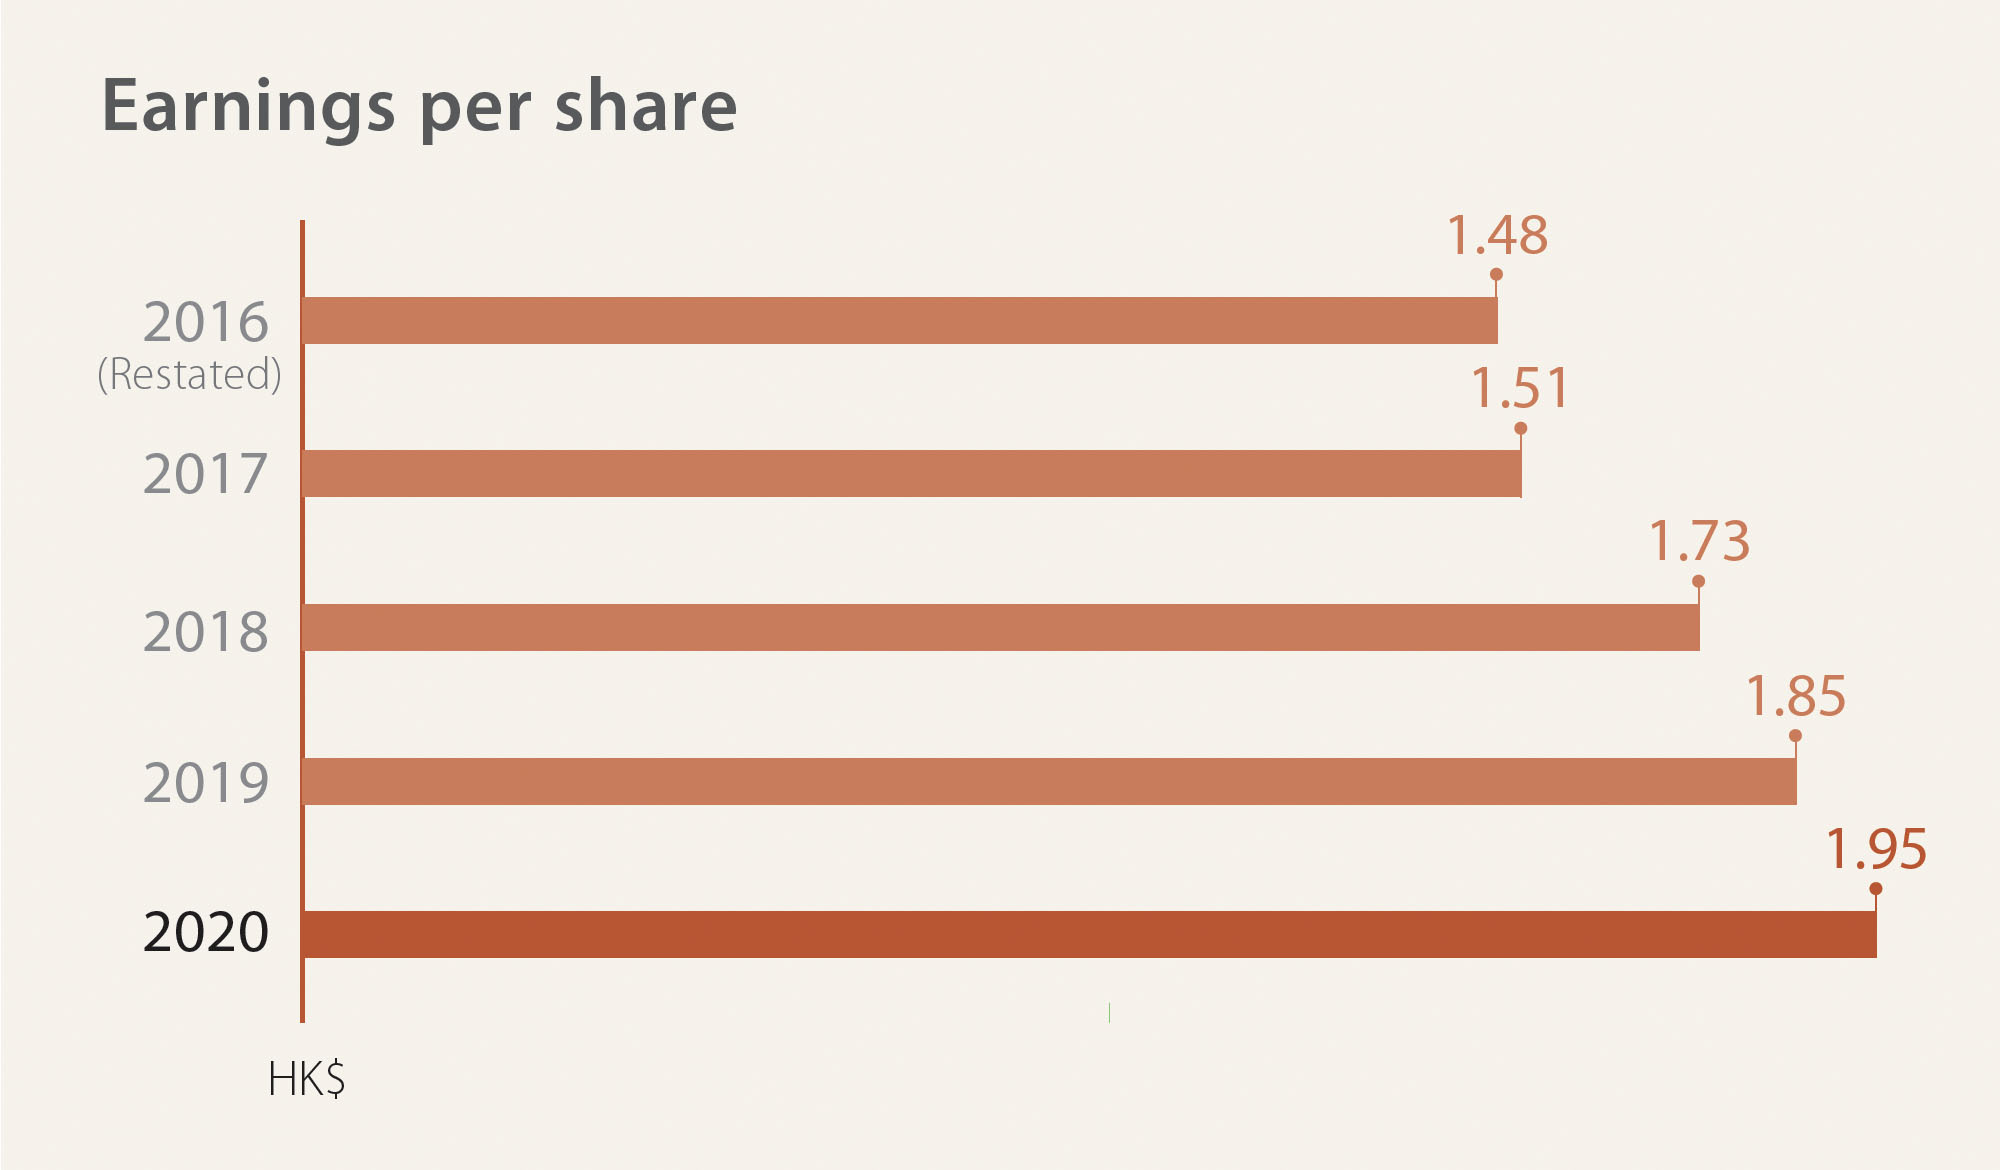
Basic earnings per share (HK$) | 1.95 | 1.85 | 5.1% |
Diluted earnings per share (HK$) | 1.95 | 1.85 | 5.1% |
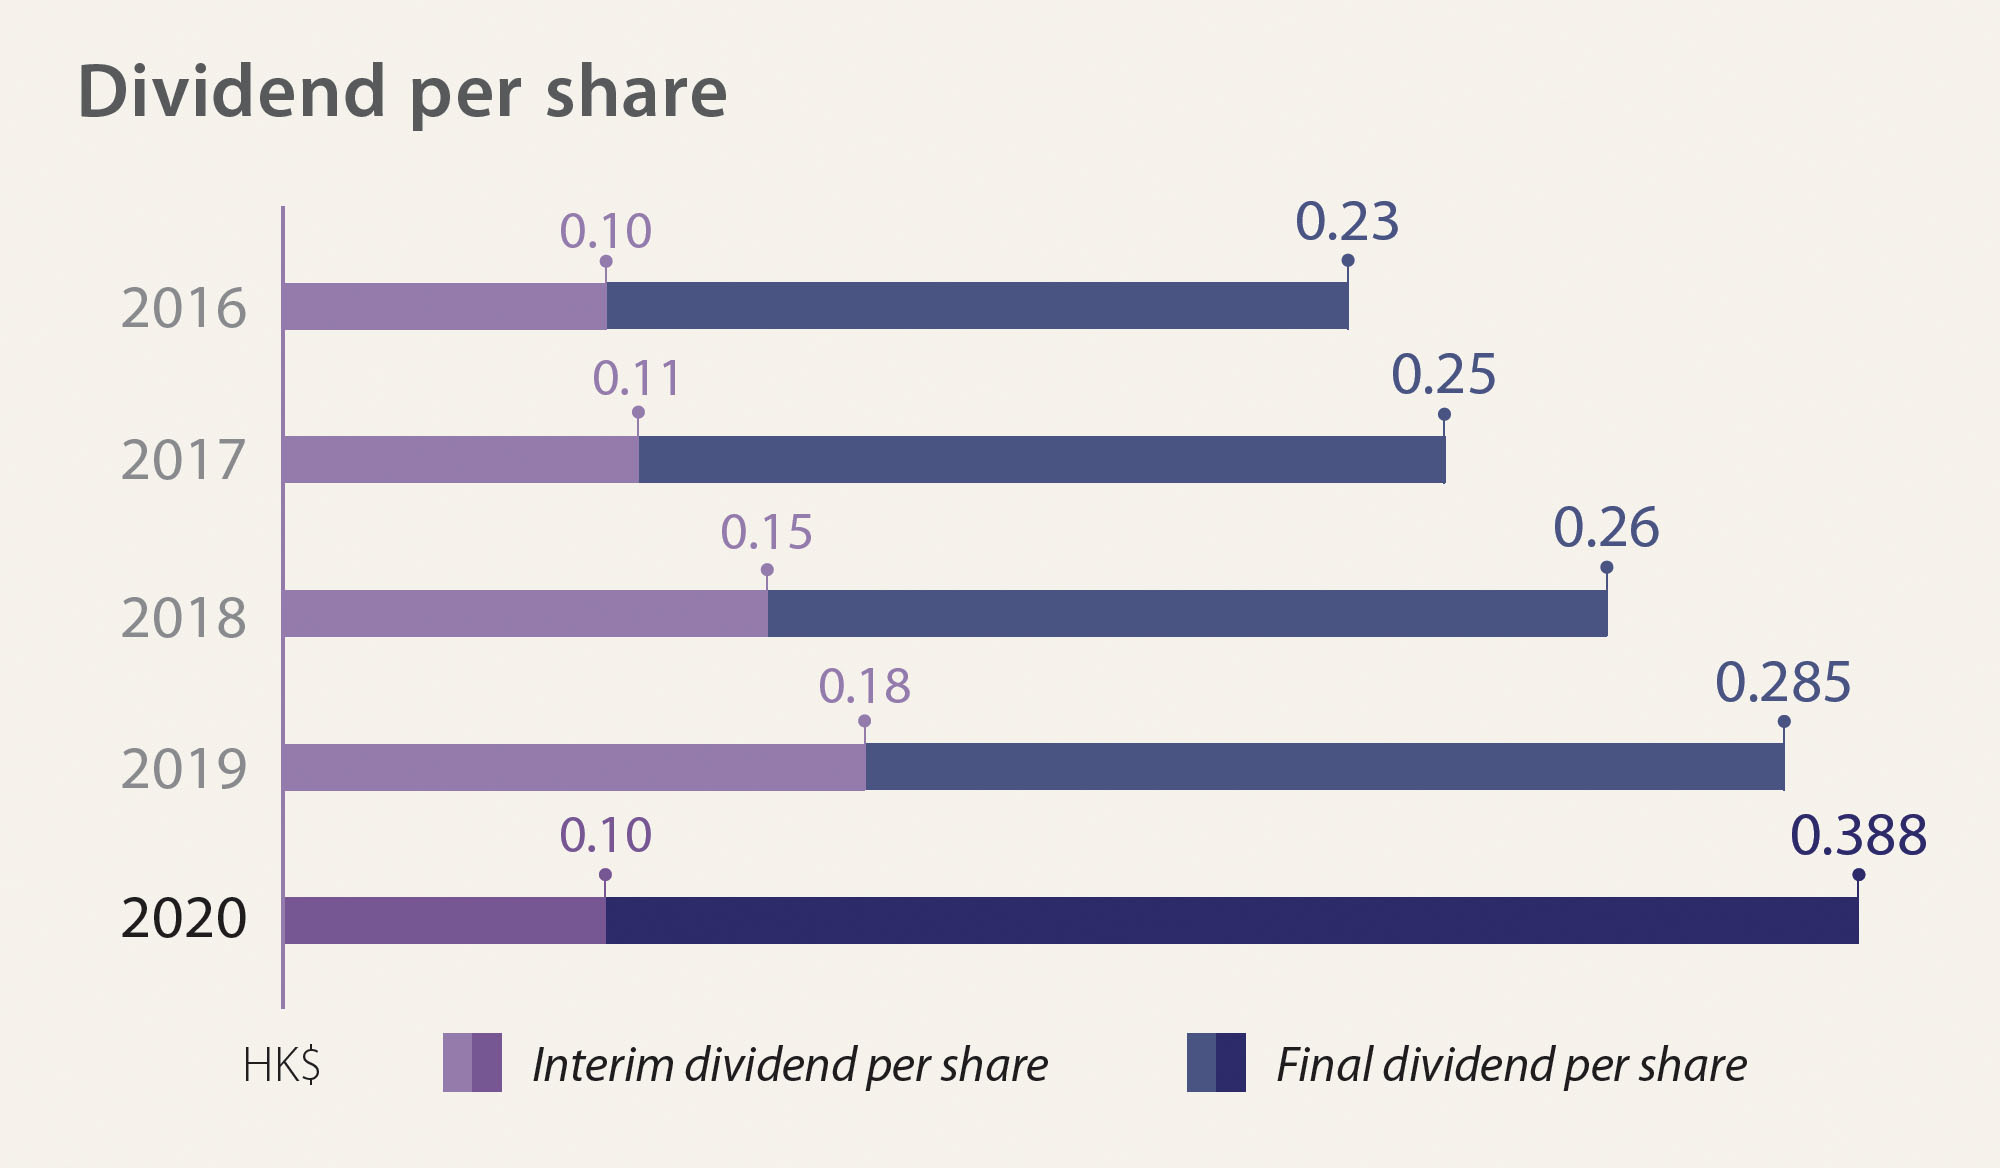
Dividend per share (HK$) | 0.488 | 0.465 | 4.9% |
Net cash generated from operating activities | 193,225 | 160,082 | 21% |
Capital expenditure | 29,616 | 32,318 | (8.4%) |
HK$ million | As at 31 December 2020 | As at 31 December 2019 | Increase/(Decrease) |
|---|---|---|---|
Total assets | 9,740,828 | 8,289,924 | 18% |
Total liabilities | 8,732,186 | 7,395,433 | 18% |
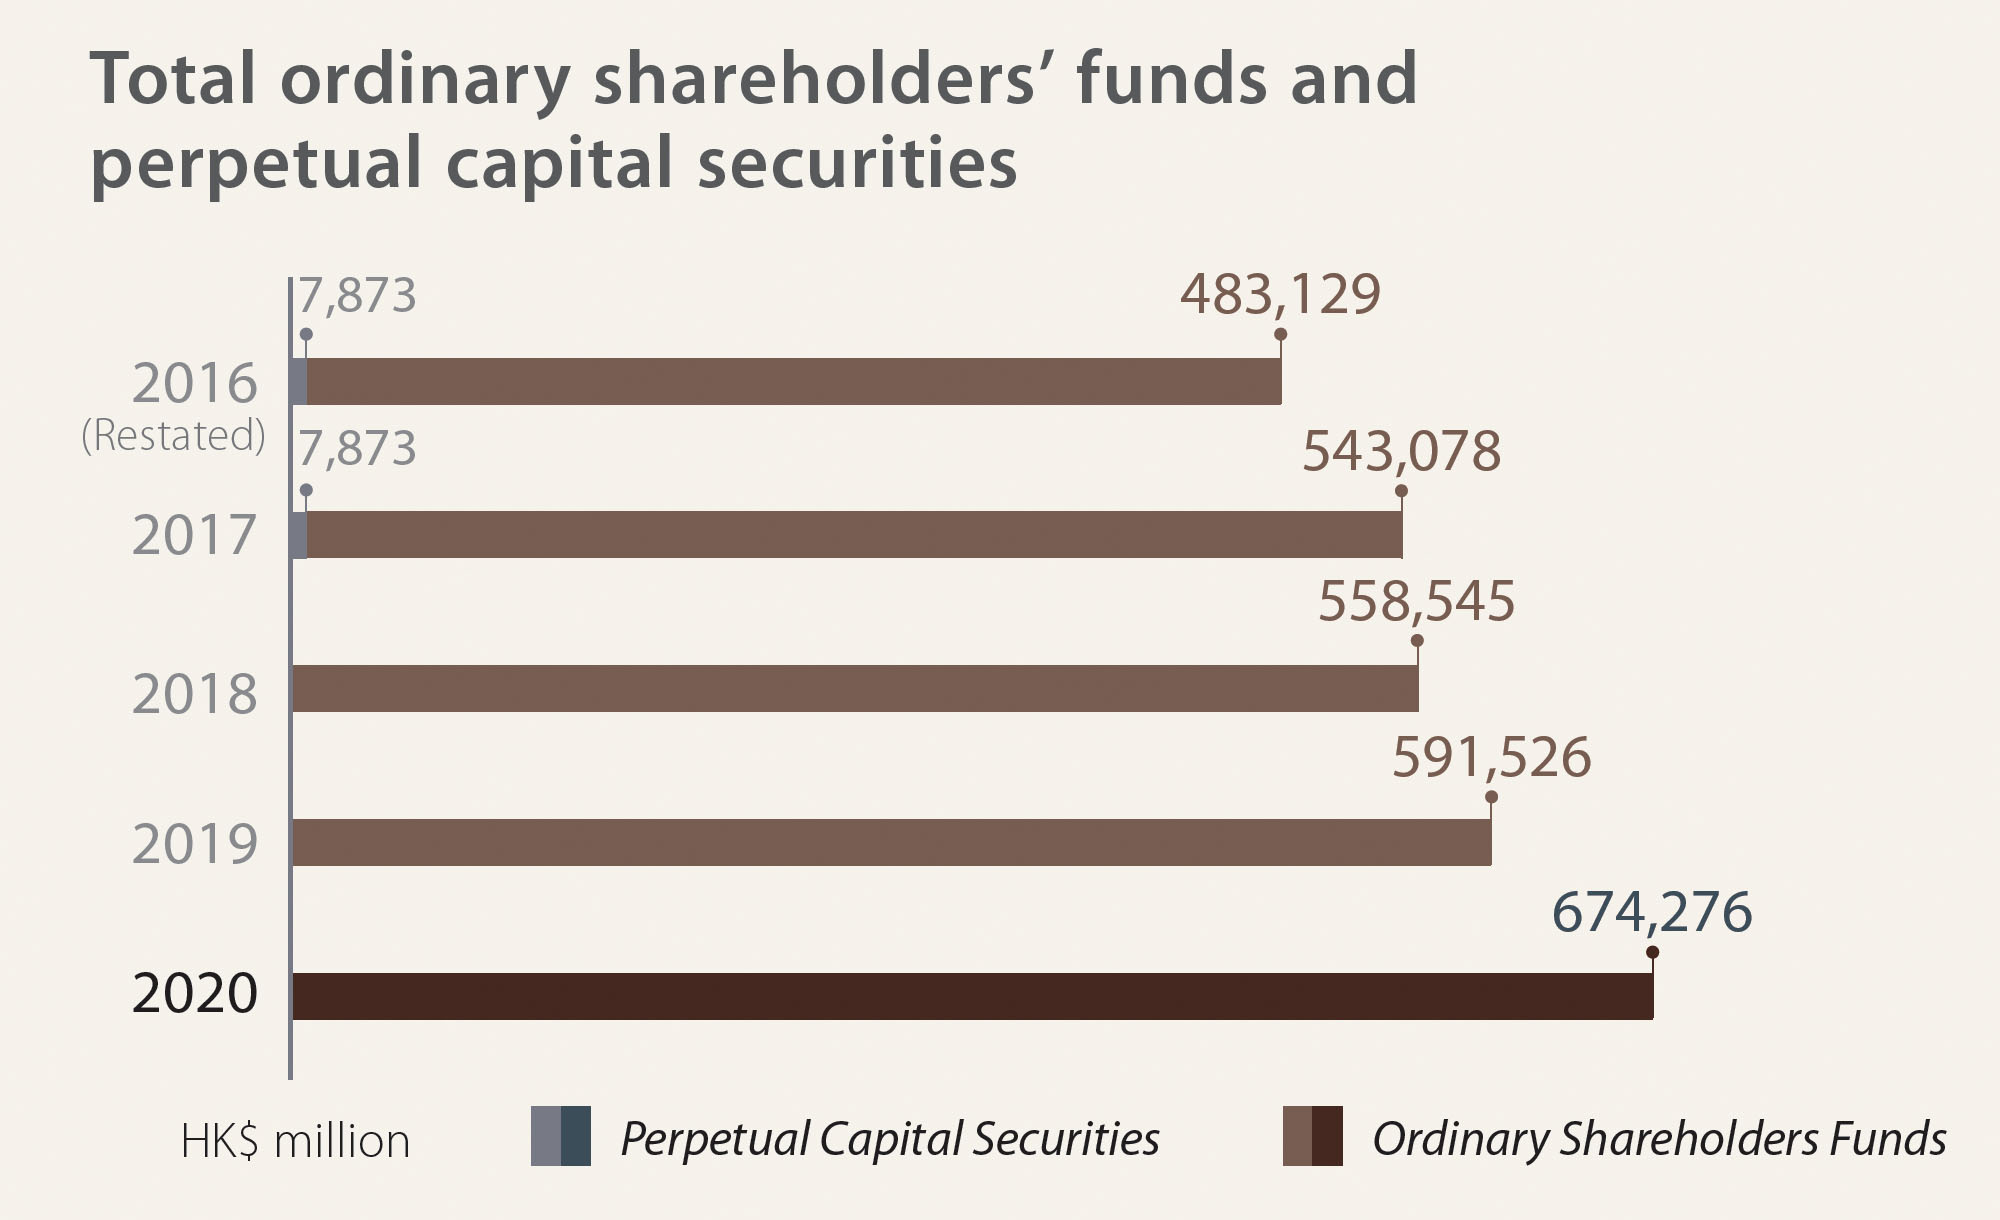
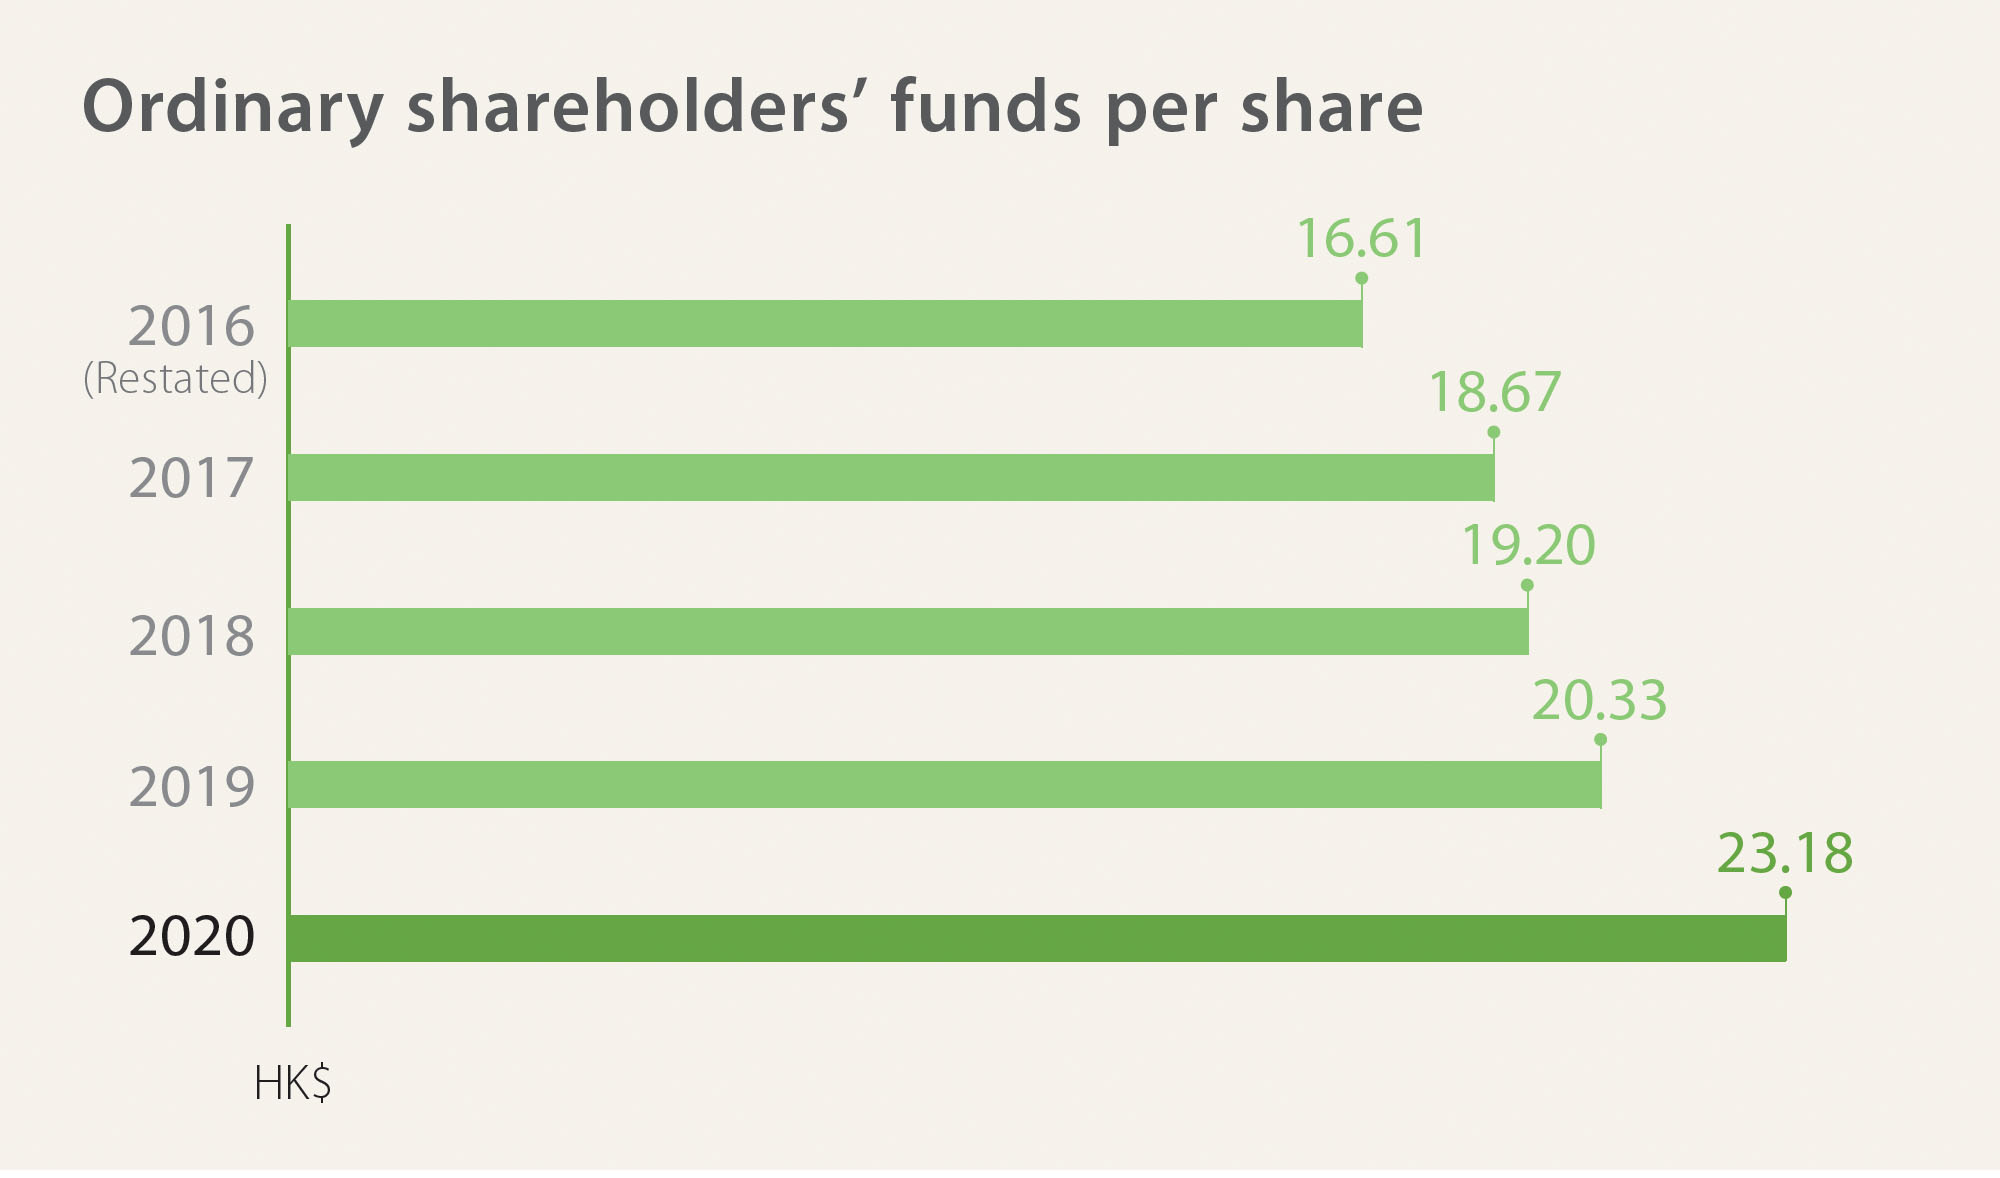
Total ordinary shareholders’ funds | 674,276 | 591,526 | 5.9% |
Return on total assets (%) | 1.2% | 1.4% | (0.2pp) |
Return on net assets (%) | 8.9% | 9.4% | 0.5pp |
Staff employed | 135,304 | 287,910 | (53%) |
Business assets | Revenue from external customers | Profit attributable to ordinary shareholders | |||||||
|---|---|---|---|---|---|---|---|---|---|
Business | As at 31 | Increase/ | Increase/ (decrease) excluding the effect of currency translation | Year ended 31 | Increase/ | Increase/ (decrease) excluding the effect of currency translation | Year ended 31 | Increase/ | Increase/ (decrease) excluding the effect of currency translation |
Comprehensive financial services | 9,113,747 | 18% | 11% | 229,103 | 3.1% | 4.4% | 43,516 | 1.6% | 2.9% |
Advanced intelligent manufacturing | 58,719 | 110% | 98% | 13,759 | (62%) | (61%) | 453 | (60%) | (59%) |
Advanced materials | 239,155 | 5.0% | 5.0% | 195,754 | 9.7% | 9.7% | 10,149 | 28% | 28% |
New consumption | 76,157 | (23%) | (24%) | 70,056 | (21%) | (21%) | 894 | (21%) | (21%) |
New-type urbanisation | 309,736 | 12% | 7.8% | 44,224 | 8.6% | 9.7% | 9,409 | 17% | 18% |