Financial Review
Group Cash Flows
| CITIC Limited Year ended 31 December | CITIC Bank Year ended 31 December | |||||||
|---|---|---|---|---|---|---|---|---|
| HK$ million | 2016 | 2015 (restated) |
Increase/ (Decrease) |
% | 2016 | 2015 | Increase/ (Decrease) |
% |
| Net cash generated from operating activities | 280,465 | 309 | 280,156 | 90665% | 255,982 | (25,948) | 281,930 | (1087%) |
| – Continuing operations | 274,809 | (451) | 275,260 | (61033%) | 255,982 | (25,948) | 281,930 | (1087%) |
| – Discontinued operations | 5,656 | 760 | 4,896 | 644% | – | – | – | – |
| Net cash used in investing activities | (211,586) | (143,528) | (68,058) | 47% | (206,426) | (177,540) | (28,886) | 16% |
| – Continuing operations | (196,699) | (142,570) | (54,129) | 38% | (206,426) | (177,540) | (28,886) | 16% |
| Including: Proceeds from disposal and redemption of financial investments |
681,246 | 884,132 | (202,886) | (23%) | 638,353 | 795,726 | (157,373) | (20%) |
| Payments for purchase of financial investments |
(855,582) | (1,018,145) | 162,563 | (16%) | (835,866) | (965,341) | 129,475 | (13%) |
| – Discontinued operations | (14,887) | (958) | (13,929) | 1454% | – | – | – | – |
| Net cash generated from/(used in) financing activities |
94,155 | 162,486 | (68,331) | (42%) | 128,830 | 192,080 | (63,250) | (33%) |
| – Continuing operations | 105,958 | 164,846 | (58,888) | (36%) | 128,830 | 192,080 | (63,250) | (33%) |
| Including: Proceeds from new bank and other loans and new debt instruments issued |
96,264 | 91,972 | 4,292 | 5% | 707,081 | 387,284 | 319,797 | 83% |
| Repayment of bank and other loans and debt instruments issued |
(706,253) | (359,657) | (346,596) | 96% | (594,111) | (190,918) | (403,193) | 211% |
| Interest paid on bank and other loans and debt instruments issued |
(28,920) | (21,853) | (7,067) | 32% | (16,603) | (10,486) | (6,117) | 58% |
| Dividends paid to ordinary shareholders |
(8,727) | (7,890) | (837) | 11% | (12,136) | – | (12,136) | 100% |
| Dividends/distribution paid to non-controlling interests/ holders of perpetual capital securities |
(7,141) | (3,119) | (4,022) | 129% | (183) | (171) | (12) | 7% |
| – Discontinued operations | (11,803) | (2,360) | (9,443) | 400% | – | – | – | – |
| Net (decrease)/increase in cash and cash equivalents |
163,034 | 19,267 | 143,767 | 746% | 178,387 | (11,408) | 189,795 | (1664%) |
| Cash and cash equivalents at 1 January | 354,111 | 347,891 | 6,220 | 2% | 270,195 | 289,496 | (19,301) | (7%) |
| Effect of exchange rate changes | (23,007) | (13,047) | (9,960) | 76% | (17,780) | (7,893) | (9,887) | 125% |
| Cash and cash equivalents at 31 December | 494,138 | 354,111 | 140,027 | 40% | 430,801 | 270,195 | 160,606 | 59% |
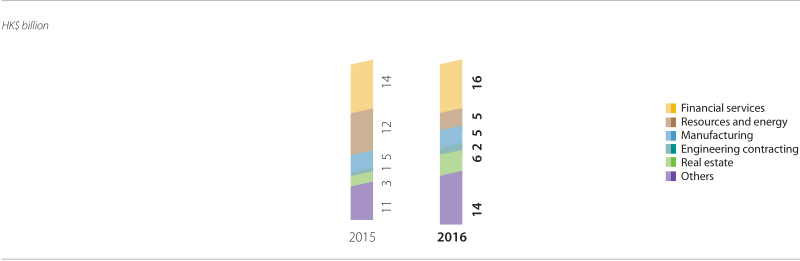
Capital Expenditures
| Year ended 31 December | Increase/(Decrease) | |||
|---|---|---|---|---|
| HK$ million | 2016 | 2015 | Amount | % |
| Financial services | 16,350 | 13,819 | 2,531 | 18% |
| Resources and energy | 4,874 | 12,059 | (7,185) | (60%) |
| Manufacturing | 5,405 | 4,937 | 468 | 9% |
| Engineering contracting | 1,564 | 508 | 1,056 | 208% |
| Real estate | 5,979 | 3,013 | 2,966 | 98% |
| Others | 14,092 | 11,368 | 2,724 | 24% |
| Total | 48,264 | 45,704 | 2,560 | 6% |
Capital Commitments
As at 31 December 2016, the contracted capital commitments of the Group amounted to approximately HK$18,004 million. Details are disclosed in note 46(f) to the financial statements.