Financial Review
Group Financial Position
| Increase/(Decrease) | |||||
|---|---|---|---|---|---|
| HK$ million | As at 31 December 2016 |
As at 31 December 2015 |
Amount | % | Note to the Financial Statements |
| Total assets | 7,237,995 | 6,803,309 | 434,686 | 6% | |
| Loans and advances to customers and other parties |
3,137,906 | 2,947,798 | 190,108 | 6% | 25 |
| Investments classified as receivables | 1,166,325 | 1,331,281 | (164,956) | (12%) | 28 |
| Cash and deposit | 927,259 | 801,615 | 125,644 | 16% | 18 |
| Available-for-sale financial assets | 642,477 | 494,786 | 147,691 | 30% | 26 |
| Held-to-maturity investments | 244,151 | 216,267 | 27,884 | 13% | 27 |
| Fixed assets | 172,236 | 183,740 | (11,504) | (6%) | 32 |
| Inventories | 48,905 | 130,447 | (81,542) | (63%) | 23 |
| Total liabilities | 6,542,144 | 6,140,140 | 402,004 | 7% | |
| Deposits from customers | 4,031,522 | 3,766,848 | 264,674 | 7% | 40 |
| Deposits from banks and non-bank financial institutions |
1,097,164 | 1,275,421 | (178,257) | (14%) | 36 |
| Debt instruments issued | 543,893 | 449,772 | 94,121 | 21% | 42 |
| Borrowing from central banks | 205,755 | 44,761 | 160,994 | 360% | |
| Financial assets sold under repurchase agreements |
134,534 | 84,949 | 49,585 | 58% | 39 |
| Bank and other loans | 112,819 | 147,221 | (34,402) | (23%) | 41 |
| Total ordinary shareholders’ funds and perpetual capital securities |
490,633 | 492,902 | (2,269) | (0.5%) | |
Total assets
Total assets increased from HK$6,803,309 million as at 31 December 2015 to HK$7,237,995 million as at 31 December 2016, mainly attributable to an increase in loans and advances to customers and other parties, available-for-sale financial assets and cash and deposits.
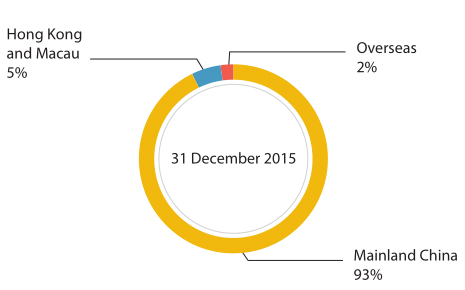
By geography

Loans and advances to customers and other parties
As at 31 December 2016, the loans and advances to customers and other parties of the Group was HK$3,137,906 million, an increase of HK$190,108 million or 6% compared to 31 December 2015. The proportion of loans and advances to customers and other parties to total assets was 43.35%, an increase of 0.02 percentage point compared to 31 December 2015.
| Increase/(Decrease) | ||||
|---|---|---|---|---|
| HK$ million | As at 31 December 2016 |
As at 31 December 2015 |
Amount | % |
| Corporate loans | 2,073,150 | 2,115,285 | (42,135) | (2%) |
| Discounted bills | 83,949 | 110,721 | (26,772) | (24%) |
| Personal loans | 1,069,417 | 798,078 | 271,339 | 34% |
| Total loans and advances to customers and other parties |
3,226,516 | 3,024,084 | 202,432 | 7% |
| Impairment allowances | (88,610) | (76,286) | (12,324) | 16% |
| Net loans and advances to customers and other parties |
3,137,906 | 2,947,798 | 190,108 | 6% |
Deposits from customers
As at 31 December 2016, deposits from customers of the financial institutions under the Group were HK$4,031,522 million, an increase of HK$264,674 million or 7% compared to 31 December 2015. The proportion of deposits from customers to total liabilities was 61.62%, a decrease of 0.27 percentage point compared to 31 December 2015.
| Increase/(Decrease) | ||||
|---|---|---|---|---|
| HK$ million | As at 31 December 2016 |
As at 31 December 2015 |
Amount | % |
| Corporate deposits | ||||
| Time deposits | 1,554,160 | 1,727,112 | (172,952) | (10%) |
| Demand deposits | 1,845,451 | 1,385,738 | 459,713 | 33% |
| Subtotal | 3,399,611 | 3,112,850 | 286,761 | 9% |
| Personal deposits | ||||
| Time deposits | 363,387 | 432,611 | (69,224) | (16%) |
| Demand deposits | 260,433 | 213,561 | 46,872 | 22% |
| Subtotal | 623,820 | 646,172 | (22,352) | (3%) |
| Outward remittance and remittance payables | 8,091 | 7,826 | 265 | 3% |
| Total | 4,031,522 | 3,766,848 | 264,674 | 7% |
Bank and other loans
| Increase/(Decrease) | ||||
|---|---|---|---|---|
| HK$ million | As at 31 December 2016 |
As at 31 December 2015 |
Amount | % |
| Financial services | 2,964 | 1,339 | 1,625 | 121% |
| Resources and energy | 41,398 | 42,562 | (1,164) | (3%) |
| Manufacturing | 15,088 | 16,521 | (1,433) | (9%) |
| Engineering contracting | 1,276 | 1,282 | (6) | (0.5%) |
| Real estate | 10,721 | 85,618 | (74,897) | (87%) |
| Others | 32,863 | 37,672 | (4,809) | (13%) |
| Operation management | 21,749 | 12,586 | 9,163 | 73% |
| Elimination | (13,240) | (50,359) | 37,119 | (74%) |
| Total | 112,819 | 147,221 | (34,402) | (23%) |
Debt instruments issued
| Increase/(Decrease) | ||||
|---|---|---|---|---|
| HK$ million | As at 31 December 2016 |
As at 31 December 2015 |
Amount | % |
| Financial services | 432,579 | 345,120 | 87,459 | 25% |
| Resources and energy | 1,453 | 446 | 1,007 | 226% |
| Manufacturing | 4,242 | 5,033 | (791) | (16%) |
| Engineering contracting | – | – | – | – |
| Real estate | – | 4,750 | (4,750) | (100%) |
| Others | 4,682 | 5,283 | (601) | (11%) |
| Operation management | 100,937 | 89,804 | 11,133 | 12% |
| Elimination | – | (664) | 664 | (100%) |
| Total | 543,893 | 449,772 | 94,121 | 21% |
Total ordinary shareholders’ funds and perpetual capital securities
As at 31 December 2016, total ordinary shareholders’ funds and perpetual capital securities amounted to HK$490,633 million, a decrease of HK$2,269 million compared to 31 December 2015. In addition to the redemption of the perpetual capital securities of US$750 million (HK$5,850 million) on 15 April 2016 by the Company, the decrease mainly was attributable to other comprehensive loss, such as exchange differences on translation of financial statements resulted from RMB depreciation in the currency period.