Group Cash Flows
| CITIC Limited | CITIC Bank | |||||||
|---|---|---|---|---|---|---|---|---|
| In HK$ million | 2015 | 2014 | Increase/ (Decrease) |
% | 2015 | 2014 | Increase/ (Decrease) |
% |
| Net cash generated from/(used in) operating activities | 309 | 58,937 | (58,628) | (99%) | (25,948) | 43,100 | (69,048) | (160%) |
| Net cash used in investing activities | (143,528) | (107,591) | 35,937 | 33% | (177,540) | (60,939) | 116,601 | 191% |
| Including: Proceeds from disposal and redemption of financial investments |
887,424 | 564,404 | 323,020 | 57% | 795,726 | 516,738 | 278,988 | 54% |
| Payments for purchase of financial investments | (1,021,956) | (653,689) | 368,267 | 56% | (965,341) | (563,452) | 401,889 | 71% |
| Net cash generated from financing activities | 162,486 | 59,518 | 102,968 | 173% | 192,080 | 56,028 | 136,052 | 243% |
| Including: Proceeds from new bank and other loans and new debt instruments issued |
506,183 | 264,747 | 241,436 | 91% | 387,284 | 123,463 | 263,821 | 214% |
| Repayment of bank and other loans and debt instruments issued | (372,928) | (180,174) | 192,754 | 107% | (190,918) | (50,161) | 140,757 | 281% |
| Interest paid on bank and other loans and debt instruments issued | (26,874) | (19,286) | 7,588 | 39% | (10,486) | (4,637) | 5,849 | 126% |
| Dividends paid to ordinary shareholders | (7,890) | (22,741) | (14,851) | (65%) | – | (9,962) | (9,962) | (100%) |
| Dividends/distribution paid to non-controlling interests/holders of perpetual capital securities | (3,206) | (7,121) | (3,915) | (55%) | (171) | (5,002) | (4,831) | (97%) |
| Net increase/(decrease) in cash and cash equivalents | 19,267 | 10,864 | 8,403 | 77% | (11,408) | 38,189 | (49,597) | (130%) |
| Cash and cash equivalents at 1 January | 347,891 | 337,894 | 9,997 | 3% | 289,496 | 253,924 | 35,572 | 14% |
| Effect of exchange rate changes | (13,047) | (867) | (12,180) | (1,405%) | (7,893) | (2,617) | (5,276) | (202%) |
| Cash and cash equivalents at 31 December | 354,111 | 347,891 | 6,220 | 2% | 270,195 | 289,496 | (19,301) | (7%) |
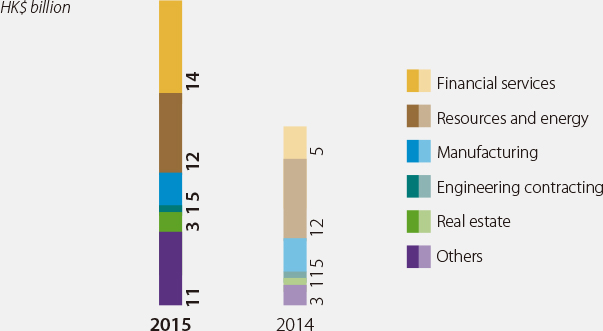
Capital Expenditures
| Increase/ (Decrease) |
||||
|---|---|---|---|---|
| In HK$ million | 2015 |
2014 (Restated) |
Amount |
% |
| Financial services | 13,820 | 5,046 | 8,774 | 174% |
| Resources and energy | 12,059 | 12,257 | (198) | (2%) |
| Manufacturing | 4,937 | 4,619 | 318 | 7% |
| Engineering contracting | 508 | 541 | (33) | (6%) |
| Real estate | 3,013 | 642 | 2,371 | 370% |
| Others | 11,367 | 3,540 | 7,827 | 221% |
| Subtotal | 45,704 | 26,645 | 19,059 | 72% |
| Real estate development | 30,470 | 33,590 | (3,120) | (9%) |
| Total | 76,174 | 60,235 | 15,939 | 26% |
Capital Commitments
As at 31 December 2015, the contracted capital commitments of the Group amounted to approximately HK$30,888 million. Details are disclosed in note 46 to the financial statements.


