Highlights
| In HK$ million | 2015 | 2014 | Increase/ (Decrease) |
|---|---|---|---|
| Revenue | 416,813 | 402,124 | 14,689 |
| Profit before taxation | 81,306 | 77,800 | 3,506 |
| Profit attributable to ordinary shareholders | 41,812 | 39,834 | 1,978 |
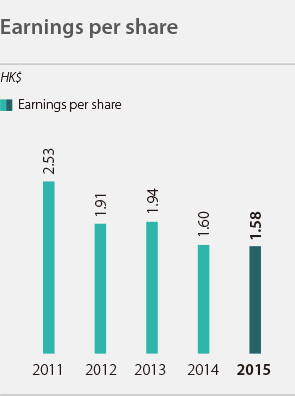
| Earnings per share (HK$) | |||
| Basic | 1.58 | 1.60 | (0.02) |
| Diluted | 1.57 | 1.60 | (0.03) |
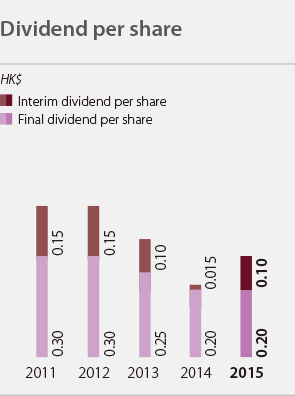
| Dividend per share (HK$) | 0.30 | 0.215 | 0.085 |
| Net cash generated from operating activities | 309 | 58,937 | (58,628) |
| Capital expenditure | 76,174 | 60,235 | 15,939 |
| Total assets | 6,803,309 | 5,947,831 | 855,478 |
| Total liabilities | 6,140,140 | 5,372,324 | 767,816 |
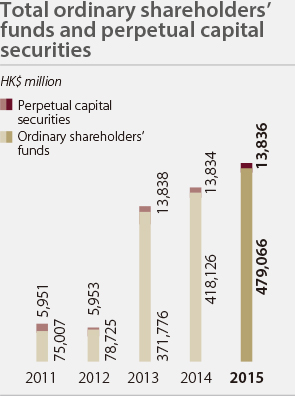
| Total ordinary shareholders’ funds and perpetual capital securities | 492,902 | 431,960 | 60,942 |
| Return on total assets (%) | 1% | 1% | 0% |
| Return on net assets (%) | 9% | 10% | (1%) |
| Staff employed | 133,526 | 125,273 | 8,253 |
| Business assets | Revenue | Profit/(loss) attributable to ordinary shareholders |
||||
|---|---|---|---|---|---|---|
| Our Businesses In HK$ million |
2015 | Increase/ (Decrease) |
2015 | Increase/ (Decrease) |
2015 | Increase/ (Decrease) |
| Financial services | 6,211,176 | 888,666 | 205,378 | 40,529 | 52,753 | 11,486 |
| Resources and energy | 141,693 | (6,210) | 45,664 | (6,122) | (17,251) | (4,238) |
| Manufacturing | 97,208 | (11,293) | 60,077 | (11,768) | 2,496 | (425) |
| Engineering contracting | 42,245 | (1,775) | 14,676 | (2,451) | 2,601 | 220 |
| Real estate | 232,809 | 17,714 | 27,528 | (2,381) | 4,137 | (557) |
| Others | 113,738 | 16,365 | 63,348 | (2,868) | 2,501 | (1,195) |
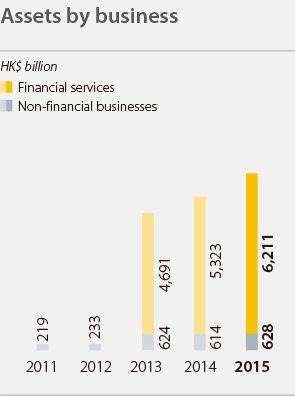
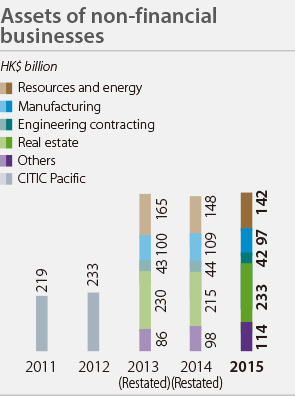
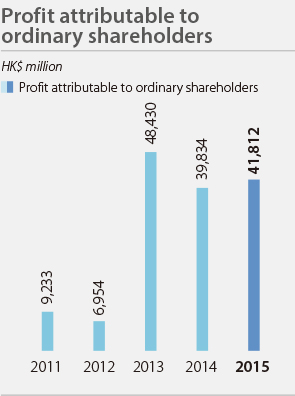
- Note:
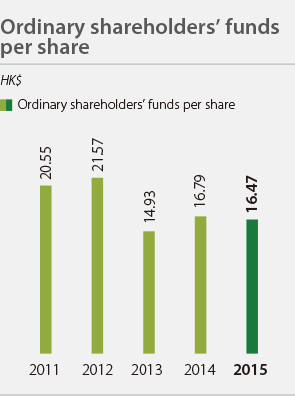
- Assets by business, profit attributable to ordinary shareholders, total ordinary shareholders’ funds and perpetual capital securities, earnings per share and ordinary shareholders’ funds per share for the years from 2011 to 2012 are from the annual reports of the former CITIC Pacific. Those for the years from 2013 to 2015 are from the audited information of CITIC Limited.