Group Cash Flows
| CITIC Limited Year ended 31 December | CITIC Bank Year ended 31 December | |||||||
|---|---|---|---|---|---|---|---|---|
| HK$ million | 2017 | 2016 (Restated) |
Increase/ (Decrease) |
% | 2017 | 2016 | Increase/ (Decrease) |
% |
| Net cash generated from operating activities | 107,133 | 280,664 | (173,531) | (62%) | 62,337 | 255,982 | (193,645) | (76%) |
| – Continuing operations | 107,133 | 275,008 | (167,875) | (61%) | 62,337 | 255,982 | (193,645) | (76%) |
| – Discontinued operations | - | 5,656 | (5,656) | (100%) | - | - | - | - |
| Net cash used in investing activities | (186,601) | (211,443) | 24,842 | 12% | (154,126) | (206,426) | 52,300 | 25% |
| – Continuing operations | (186,601) | (196,556) | 9,955 | 5% | (154,126) | (206,426) | 52,300 | 25% |
| Including: Proceeds from disposal and redemption of financial investments |
1,214,792 | 681,316 | 533,476 | 78% | 1,161,160 | 638,353 | 522,807 | 82% |
| Payments for purchase of financial investments |
(1,374,211) | (855,491) | (518,720) | (61%) | (1,304,519) | (835,866) | (468,653) | (56%) |
| – Discontinued operations | - | (14,887) | 14,887 | 100% | - | - | - | - |
| Net cash generated from/(used in) financing activities |
53,350 | 93,796 | (40,446) | (43%) | 45,473 | 128,830 | (83,357) | (65%) |
| – Continuing operations | 53,350 | 105,599 | (52,249) | (49%) | 45,473 | 128,830 | (83,357) | (65%) |
| Including: Proceeds from new bank and other loans and new debt instruments issued |
1,117,983 | 824,052 | 293,931 | 36% | 994,755 | 707,081 | 287,674 | 41% |
| Repayment of bank and other loans and debt instruments issued |
(1,024,877) | (707,062) | (317,815) | (45%) | (923,922) | (594,111) | (329,811) | (56%) |
| Interest paid on bank and other loans and debt instruments issued |
(31,797) | (28,937) | (2,860) | (10%) | (20,404) | (16,603) | (3,801) | (23%) |
| Dividends paid to ordinary shareholders | (9,891) | (8,727) | (1,164) | (13%) | (14,002) | (12,136) | (1,866) | (15%) |
| Dividends/distribution paid to non-controlling interests/holders of perpetual capital securities |
(8,838) | (7,141) | (1,697) | (24%) | - | (183) | 183 | 100% |
| – Discontinued operations | - | (11,803) | 11,803 | 100% | - | - | - | - |
| Net (decrease)/increase in cash and cash equivalents |
(26,118) | 163,017 | (189,135) | (116%) | (46,316) | 178,387 | (224,703) | (126%) |
| Cash and cash equivalents at 1 January | 494,179 | 354,171 | 140,008 | 40% | 430,801 | 270,195 | 160,606 | 59% |
| Effect of exchange rate changes | 23,302 | (23,009) | 46,311 | 201% | 19,763 | (17,780) | 37,542 | 211% |
| Cash and cash equivalents at 31 December |
491,363 | 494,179 | (2,816) | (0.6%) | 404,248 | 430,801 | (26,553) | (6%) |
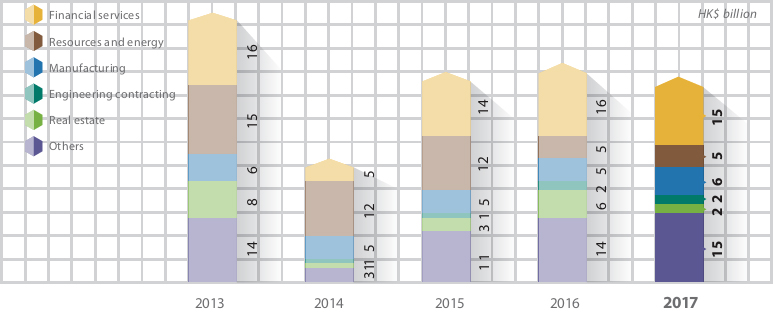
Capital Expenditures
| Year ended 31 December | Increase/(Decrease) | |||
|---|---|---|---|---|
| HK$ million | 2017 | 2016 | Amount | % |
| Financial services | 14,880 | 16,350 | (1,470) | (9%) |
| Resources and energy | 5,429 | 4,874 | 555 | 11% |
| Manufacturing | 5,861 | 5,405 | 456 | 8% |
| Engineering contracting | 1,784 | 1,564 | 220 | 14% |
| Real estate | 2,436 | 5,979 | (3,543) | (59%) |
| Others | 14,933 | 14,092 | 841 | 6% |
| Total | 45,323 | 48,264 | (2,941) | (6%) |
Capital Commitments
As at 31 December 2017, the contracted capital commitments of the Group amounted to approximately HK$20,794 million. Details are disclosed in note 46(f) to the financial statements.