Highlights
| Year ended 31 December | |||
|---|---|---|---|
| HK$ million | 2017 | 2016 (Restated) |
Increase/ (Decrease) |
| Continuing operations | |||
| Revenue | 450,536 | 381,662 | 68,874 |
| Profit before taxation | 82,783 | 70,791 | 11,992 |
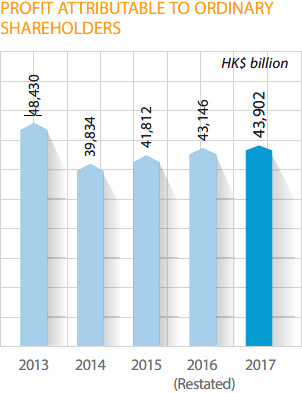
| Profit/(loss) attributable to ordinary shareholders | 43,902 | 43,146 | 756 |
| – Continuing operations | 43,902 | 32,809 | 11,093 |
| – Discontinued operations | - | 10,337 | (10,337) |
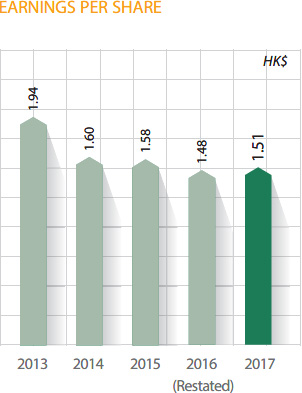
| Basic earnings per share from (HK$): | 1.51 | 1.48 | 0.03 |
| – Continuing operations | 1.51 | 1.13 | 0.38 |
| – Discontinued operations | - | 0.35 | (0.35) |
| Diluted earnings per share from (HK$): | 1.51 | 1.48 | 0.03 |
| – Continuing operations | 1.51 | 1.13 | 0.38 |
| – Discontinued operations | - | 0.35 | (0.35) |
| Dividend per share (HK$) | 0.36 | 0.33 | 0.03 |
| Net cash generated from operating activities | 107,133 | 280,664 | (173,531) |
| – Continuing operations | 107,133 | 275,008 | (167,875) |
| – Discontinued operations | - | 5,656 | (5,656) |
| Capital expenditure | 45,323 | 48,264 | (2,941) |
| HK$ million | As at 31 December 2017 |
As at 31 December 2016 (Restated) |
Increase/ (Decrease) |
|---|---|---|---|
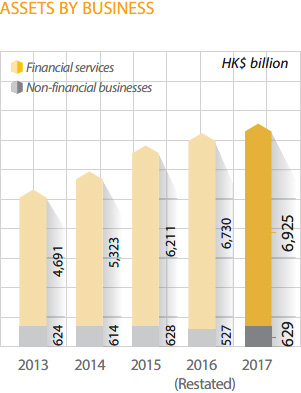
| Total assets | 7,520,739 | 7,239,489 | 281,250 |
| Total liabilities | 6,727,098 | 6,542,816 | 184,282 |
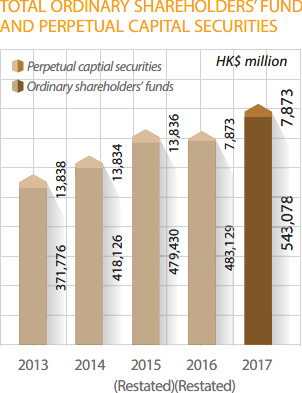
| Total ordinary shareholders’ funds and perpetual capital securities |
550,951 | 491,002 | 59,949 |
| Return on total assets (%) | 1% | 1% | - |
| Return on net assets (%) | 9% | 9% | - |
| Staff employed | 243,036 | 127,610 | 115,426 |
| Business assets |
Revenue from continuing operations |
Profit attributable to ordinary shareholders from continuing operations |
||||
|---|---|---|---|---|---|---|
| Businesses HK$ million |
As at 31 December 2017 |
Increase/ Decrease) |
Year ended 31 December 2017 |
Increase/ Decrease) |
Year ended 31 December 2017 |
Increase/ Decrease) |
| Financial services | 6,925,076 | 195,174 | 190,028 | 2,494 | 39,506 | 1,100 |
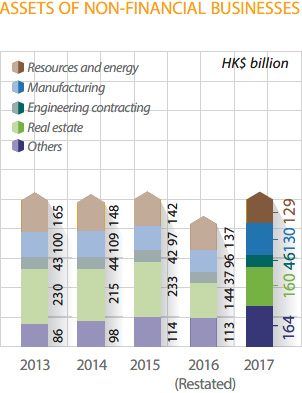
| Resources and energy | 129,438 | (7,899) | 63,456 | 12,359 | (9,900) | (3,028) |
| Manufacturing | 130,381 | 34,269 | 97,432 | 35,082 | 3,318 | 1,578 |
| Engineering contracting | 46,127 | 9,331 | 14,653 | 3,630 | 1,731 | 56 |
| Real Estate | 159,664 | 16,068 | 3,227 | (1,673) | 7,660 | 5,886 |
| Others | 163,835 | 50,745 | 81,673 | 16,950 | 9,455 | 7,468 |

