Group Financial Position
| HK$ million | As at 31 December 2017 |
As at 31 December 2016 (Restated) |
Increase/(Decrease) | Note to the Financial Statements |
|
|---|---|---|---|---|---|
| Amount | % | ||||
| Total assets | 7,520,739 | 7,239,489 | 281,250 | 4% | |
| Loans and advances to customers and other parties |
3,721,886 | 3,137,850 | 584,036 | 19% | 25 |
| Cash and deposit | 924,584 | 927,382 | (2,798) | (0.3%) | 18 |
| Available-for-sale financial assets | 807,912 | 642,477 | 165,435 | 26% | 26 |
| Investments classified as receivables | 644,789 | 1,166,325 | (521,536) | (45%) | 28 |
| Held-to-maturity investments | 261,654 | 244,151 | 17,503 | 7% | 27 |
| Fixed assets | 196,047 | 173,326 | 22,721 | 13% | 32 |
| Inventories | 58,552 | 49,000 | 9,552 | 19% | 23 |
| Total liabilities | 6,727,098 | 6,542,816 | 184,282 | 3% | |
| Deposits from customers | 4,056,158 | 4,031,519 | 24,639 | 0.6% | 40 |
| Deposits from banks and nonbank financial institutions |
954,638 | 1,097,164 | (142,526) | (13%) | 36 |
| Debt instruments issued | 653,371 | 543,893 | 109,478 | 20% | 42 |
| Borrowing from central banks | 284,818 | 205,755 | 79,063 | 38% | |
| Financial assets sold under repurchase agreements |
160,902 | 134,534 | 26,368 | 20% | 39 |
| Bank and other loans | 142,442 | 113,125 | 29,317 | 26% | 41 |
| Total ordinary shareholders’ funds and perpetual capital securities |
550,951 | 491,002 | 59,949 | 12% | |
Total assets
Total assets increased from HK$7,239,489 million as at 31 December 2016 to HK$7,520,739 million as at 31 December 2017, mainly attributable to an increase in loans and advances to customers and other parties, available-for-sale financial assets, and fixed assets, whereas investment classified as receivables was decreased compared to the same period of last year.
By geography
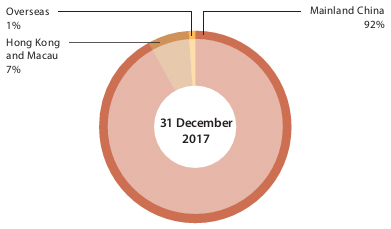
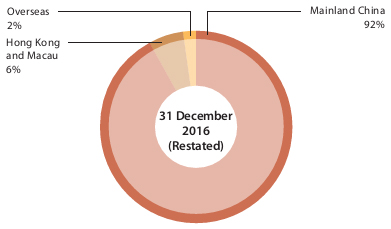
Loans and advances to customers and other parties
As at 31 December 2017, the loans and advances to customers and other parties of the Group was HK$3,721,886 million, an increase of HK$584,036 million or 19% compared to 31 December 2016. The proportion of loans and advances to customers and other parties to total assets was 49.49%, an increase of 6.15 percentage point compared to 31 December 2016.
| HK$ million | As at 31 Decembe 2017 |
As at 31 December 2016 (Restated) |
Increase/(Decrease) | |
|---|---|---|---|---|
| Amount | % | |||
| Corporate loans | 2,231,671 | 2,073,094 | 158,577 | 8% |
| Discounted bills | 130,190 | 83,949 | 46,241 | 55% |
| Personal loans | 1,473,346 | 1,069,417 | 403,929 | 38% |
| Total loans and advances to customers and other parties |
3,835,207 | 3,226,460 | 608,747 | 19% |
| Impairment allowances | (113,321) | (88,610) | (24,711) | (28%) |
| Net loans and advances to customers and other parties |
3,721,886 | 3,137,850 | 584,036 | 19% |
Deposits from customers
As at 31 December 2017, deposits from customers of the financial institutions under the Group were HK$4,056,158 million, an increase of HK$24,639 million or 0.6% compared to 31 December 2016. The proportion of deposits from customers to total liabilities was 60.30%, a decrease of 1.32 percentage point compared to 31 December 2016.
| HK$ million | As at 31 Decembe 2017 |
As at 31 December 2016 (Restated) |
Increase/(Decrease) | |
|---|---|---|---|---|
| Amount | % | |||
| Corporate deposits | ||||
| Time deposits | 1,463,098 | 1,554,160 | (91,062) | (6%) |
| Demand deposits | 1,947,517 | 1,845,448 | 102,069 | 6% |
| Subtotal | 3,410,615 | 3,399,608 | 11,007 | 0.3% |
| Personal deposits | ||||
| Time deposits | 357,069 | 363,387 | (6,318) | (2%) |
| Demand deposits | 281,084 | 260,433 | 20,651 | 8% |
| Subtotal | 638,153 | 623,820 | 14,333 | 2% |
| Outward remittance and remittance payables |
7,390 | 8,091 | (701) | (9%) |
| Total | 4,056,158 | 4,031,519 | 24,639 | 0.6% |
Bank and other loans
| HK$ million | As at 31 Decembe 2017 |
As at 31 December 2016 (Restated) |
Increase/(Decrease) | |
|---|---|---|---|---|
| Amount | % | |||
| Financial services | 7,176 | 2,964 | 4,212 | 142% |
| Resources and energy | 43,900 | 41,759 | 2,141 | 5% |
| Manufacturing | 28,130 | 15,088 | 13,042 | 86% |
| Engineering contracting | 1,267 | 1,276 | (9) | (0.7%) |
| Real estate (Note) | 7,898 | 10,721 | (2,823) | (26%) |
| Others | 41,934 | 32,863 | 9,071 | 28% |
| Operation management | 34,605 | 21,749 | 12,856 | 59% |
| Elimination | (22,468) | (13,295) | (9,173) | (69%) |
| Total | 142,442 | 113,125 | 29,317 | 26% |
Debt instruments issued
| HK$ million | As at 31 Decembe 2017 |
As at 31 December 2016 (Restated) |
Increase/(Decrease) | |
|---|---|---|---|---|
| Amount | % | |||
| Financial services | 529,238 | 432,579 | 96,659 | 22% |
| Resources and energy | 598 | 1,453 | (855) | (59%) |
| Manufacturing | 2,632 | 4,242 | (1,610) | (38%) |
| Engineering contracting | - | - | - | - |
| Real estate | - | - | - | - |
| Others | 5,175 | 4,682 | 493 | 11% |
| Operation management | 115,728 | 100,937 | 14,791 | 15% |
| Elimination | - | - | - | - |
| Total | 653,371 | 543,893 | 109,478 | 20% |
Total ordinary shareholders’ funds and perpetual capital securities
As at 31 December 2017, total ordinary shareholders’ funds and perpetual capital securities amounted to HK$550,951 million, an increase of HK$59,949 million compared to 31 December 2016, which mainly was attributable to the increase in net profit in the currency period.